Date: July 29, 2012
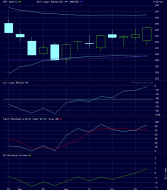
SPY Weekly 7-29.png
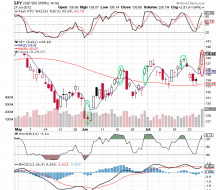
3 month SPY weekly shows market overbought on weekly basis for Fast Stochastic and Williams %R. OBV shows accumulatio...

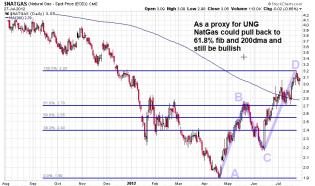
UNG July 30.jpg
As a proxy for UNG - $NatGas could pull back to 61.8% fib and 200dma and still be bullish

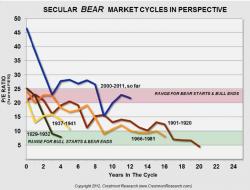
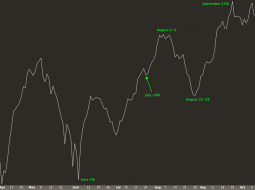
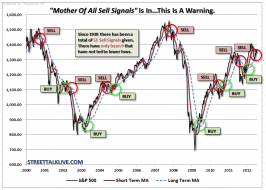
Bear Markets In Perspective.jpg (725×549)
Interview with Eric Sprott for all you PM fans out there (myself included).
The Coming of the World Depression
Interview with Eric Sprott for all you PM fans out there (myself included).


http://content.screencast.com/users/Nf6/folders/Jing/media/6e6b9bed...
AUD/JPY approaching resistance at 83. Failure here could indicate a downturn in equities.


6a00d83451591e69e2017743b0ee71970d-pi (1350×850)

1
Ron Paul Questions Timothy Geithner 7/25/12
Ron Paul Questions Timothy Geithner 7/25/12 - YouTube
Ron Paul Questions Timothy Geithner 7/25/12
3

Screen shot 2012-07-29 at 5.55.41 PM.png
Some earnings plays care of MS over on SOH.
Evil Plan 77.0...........
The Royal Olympic Jump
The Royal Olympic Jump................Evil Plan 77.0 (by BDI) -...
Evil Plan 77.0...........
The Royal Olympic Jump
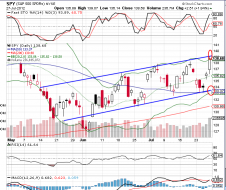
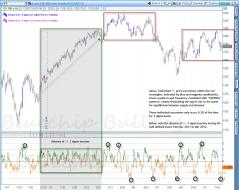
July 29.png
Channel intact, upper channel reached per chart from July 26. Further push higher seems entirely predicated on gov...
2
5 MA Divergence July 29.png
5 day MA is very stretched. Some filling/retracement likely..
2

Chart In Focus
Are we Going higher or lower. Bad news we rally so im assuming when QE3 comes about we dump...?

http://changeintrend.files.wordpress.com/2012/07/correlation-2012-0...
MS cycles.
4
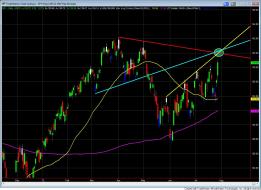
SPY resistance.jpg

1
http://www.321gold.com/editorials/sfs/hubbartt072712/gold_summer.gif
3
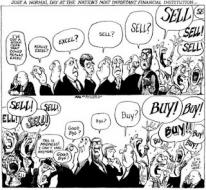
20120725_sell.png

5
original.jpg (1199×950)
3

http://rpseawright.files.wordpress.com/2012/07/math-of-loss1.png

3
Hernando de Soto @ 21:15 ~ 36:40
... on the Rule of Law - with the proviso that context is everythingWhat does the Rule of Law need?TransparencyInclusivenessDemocratic accountabilityRegarding property rights in the US ~ and the delive...
Tahoe is Walking On: Hernando de Soto - Property Rights and the...


zerohedge.com/sites/defaul...ing%20Gap.jpg

Cartoon bernanke geithner
Trading Blues: For the Week Ahead

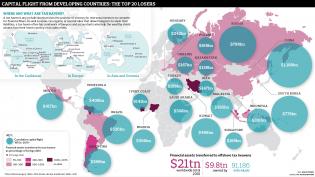
gu_wealth-offshore-02.jpg (2906×1642)
1
dshort Featured Charts
A turning point for Treasuries?

2012-07-27_1122.png

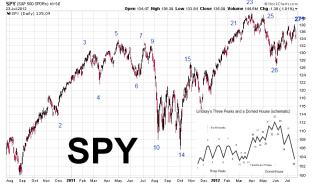
SPY Three Peaks and a Domed House July 2012.jpg
13
We've now crossed the apex of earnings season, and the number of reports we get each week through mid-August will now drift lower. ? But there are still quite a few big name companies left to report Q2 numbers. ? Below is a list of th...
Bespoke Investment Group - Think BIG - Key Earnings Reports Next Week
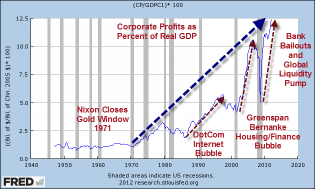
Sharp Decline in Earnings and Revenue Estimates
Corporate profits as a percentage of real GDP
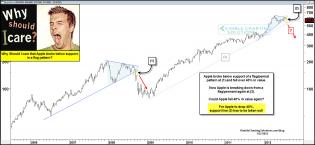
appleflagbreakdownwhycarejuly271.jpg (1575×726)
The risk to Apple shareholders
1

dshort Featured Charts
The components of real GDP since 2007
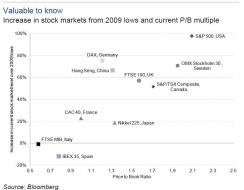
Stock vs PB.jpg (809×629)
Interesting analysis of what stock markets around the world have done since the 2009 bottom and what their current...
3
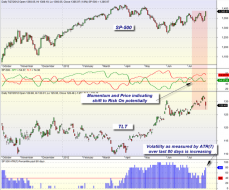
mybestfunds.com: Market Momentum: SPY versus TLT 20120729
Momentum starting to shift slowly to Risk On - seen more clearly in price action.