Date: May 18, 2012
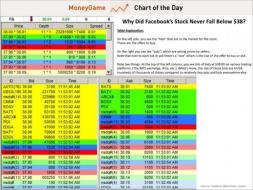
chart of the day, facebook stock performance, may 2012
Why Facebook never fell below $38 per share

Why Facebook never fell below $38 per share
CHART OF THE DAY: Why Facebook Never Fell Below $38 Per Share -...
Why Facebook never fell below $38 per share
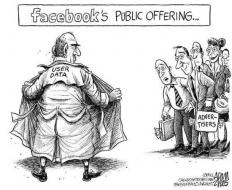
http://0.tqn.com/d/politicalhumor/1/0/a/Y/4/Facebook-Public-Offerin...

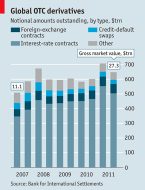
Global OTC derivatives | The Economist
Global OTC derivatives
The notional amount of outstanding over-the-counter (OTC) derivatives declined to $648 tri...
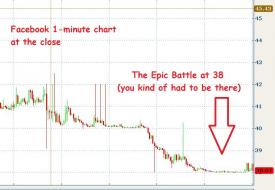
http://www.thereformedbroker.com/wp-content/uploads/2012/05/FB-clos...
The epic battle to defend Facebook at $38.00
http://blog.kimblechartingsolutions.com/wp-content/uploads/2012/05/...
U.S. Dollar chart by Kimble

BALLOON LAUNCH
The bubble

SOCIALMANIA
The offering!
1

FACE POP

FadeBook | ZeroHedge
The desperate effort to make damned sure Facebook didn't dip below its offering price.

Chart of the Day - 112-year lows for the 10 year T-bond yield
Chart of 10-year bond yield
http://content.screencast.com/users/hokiejch/folders/Jing/media/4b1...
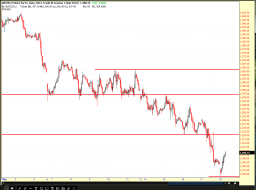
ES/ hourly 5/18/12