Date: May 8, 2012
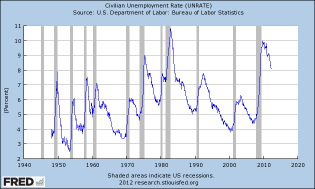
Graph of Civilian Unemployment Rate
Unemployment rate, since about World War 2, in the United States
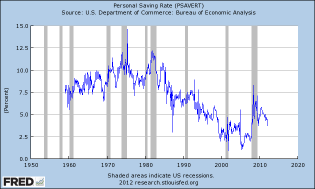
Graph of Personal Saving Rate
Personal savings rate in the United States

Graph of Federal Government Debt: Total Public Debt
The hockey-stick chart of the exploding US federal debt
![Graph of Federal Surplus or Deficit [-]](https://s3.amazonaws.com/cdn2.socialtrade.com/st/shards/153_vhUw42Zr_h)
Graph of Federal Surplus or Deficit [-]
Federal surplus or deficit - - shocking what's happened recently

Graph of 30-Year Conventional Mortgage Rate
Mortgage rates from 1970 to present
So fucking true it's sickening....
Guest Post: The Yemen Underwear Bomb and Other Hobgoblins | ZeroHedge
So fucking true it's sickening....

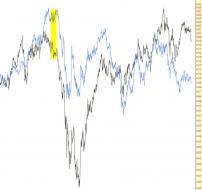
0508-nzdthree
Relative position of the NZD/USD and EUR/USD back in 2008. It seems like they are ready to tumble from this point.
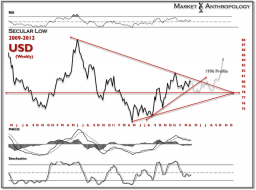
Market Anthropology: Window of Opportunity
Projected path for US dollar, which would be very bearish for equities
2
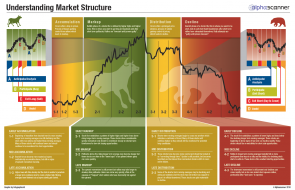
marketstructure.png (1374×884)
19
DOOMED, Doomed I say!
The cascading waves of debt implosion – 5 charts looking at de...
DOOMED, Doomed I say!