Date: May 2012: MOO Trend Guide.png
MOO Trend Guide.png
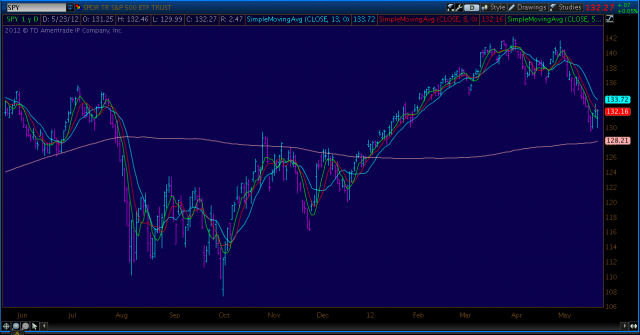
Below is the chart I am watching carefully and will be using as a trend guide. The blue, red, and green lines are smoothed 13, 8, and 5 period bars displaced forward by 8, 5, and 3 bars respectively. What I hope will happen is that we have the opportunity to go short again. Right now the distance between these smas is pronounced and separated from each other (not crisscrossing) and offers an opportunity as it has in the past. I've used it like this:
When the red line crosses the blue from above, its time to start a short.
(see #1 example below)
When the red line crosses the blue from below, its time to start a long.
(see #4 example below)
If the lines are close together, crisscrossing, and/or flattish - DO NOT TRADE. Stats have shown that profitable trends only happen between 15%-30% of the time, so why trade the noise?
Cover a short when the red line, from below, crosses the green line.
(see #2 example below)
Close the long when the red line, from above, crosses t
Comments
No comments yet.


