Date: November 9, 2012

content.screencast.com/use.../VIX11912.gif
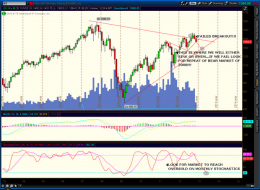
VIX hourly chart. A rocketship in search of a match.

1
Founding Fathers.jpg

1

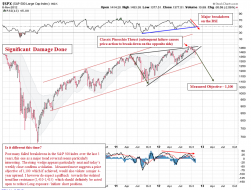
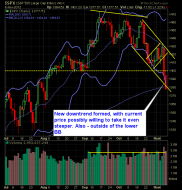
$SPX
SPX daily with 3 and 10 EMAs (11/9/12) bearish

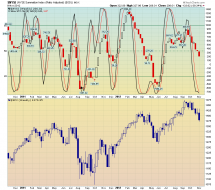
$NYSI
NYSE Summation Index weekly with slow stochastics (5,3) (11/9/12)
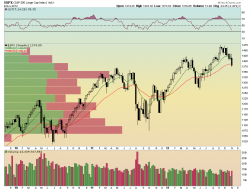
$SPX
SPX weekly with 13 and 34 EMAs (11/9/12) price has closed below both EMAs
1109-spx.png
A fantastic graph emailed to me today
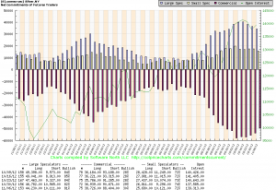
SI
Silver CoT improves but remains in bearish state. Open interest still way up.


GC
Gold CoT improves, but not drastically as expected.
INVN Short setup

nysewilshirehugehandspatternoct25.gif (1561×666)
Massive pattern in place
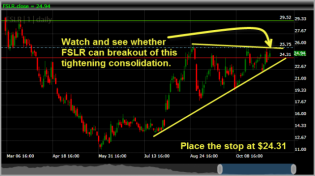
First Solar breakout swing trade strategy
2
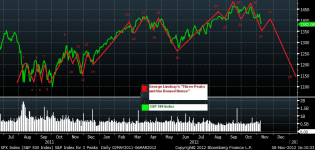
ThreePeaksandtheDomedHouse4pm_20121108.png (982×468)
Three Peaks and a Domed House
THE FISCAL CLIFF
The Fiscal Cliff

Trade-deficit-110812.PNG (995×535)
The chart below shows the trend of deterioration in imports and exports and its net effect on the economy. As alw...

japan debt.jpg (1027×719)
Last night, Japan issued an update of its total public debt. The number was ¥983 as of September 30. Trillion. Th...

spx 5 min.png
SPX: CORRECTIVE BOUNCE


au.spx
Gold vs. S&P 500 over 30+ years.

BroadMarket.jpg

2

Stage1irl.jpg
2

Stage1irl.jpg

Stage1kol.jpg
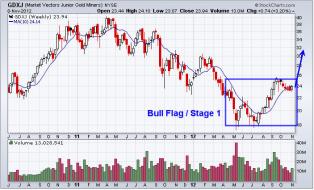
Stage1gdxj.jpg

1109-aapl
Apple's path to the mid-400s
content.screencast.com/use...RUSD11912.gif
EUR/USD wedge
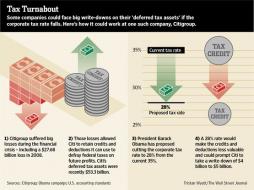
ritholtz.com/blog/wp-conte...ax-twist.jpeg

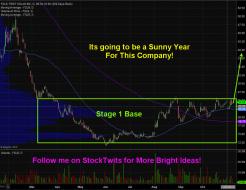
fslr.jpg
This is a no brainer to take position in... BRIGHT IDEA to be honest!
1
321gold.com/editorials/sfs.../usd_sell.gif
S and P 500 Market Analysis 11-09-12
The Slippery Slope Investment and Chuckle Forum: S&P On The Edge...


Chart In Focus
AAPL compared to RCA during 1929 crash.
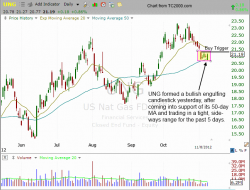
$UNG pullback setup
Despite the stock market being very weak lately, this article highlights two ETFs setting up for low-risk swing tr...


DX 60 MIN.png
USD INDEX: FINAL WAVE (C) ?
SPX: FOLLOW UP OF THE SHORT TERM EWP
SPX: Follow Up of the Short Term EWP | The wave trading
SPX: FOLLOW UP OF THE SHORT TERM EWP