Date: October 25, 2012
2012-10-25_VIX


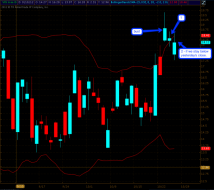
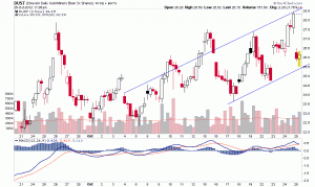
ES GLOBEX 15 MIN.png
ES GLOBEX : POSSIBLE ENDING DIAGONAL

dshort Featured Charts
Core CAPEX as a Recession Indicator
1

20121025_jobcuts.png (858×701)
CEOs simply do not, in reality, strategize on hope - its simple, lay off first, hope second!

AMZN Chartjpg.jpg (1056×569)
Amazon net income
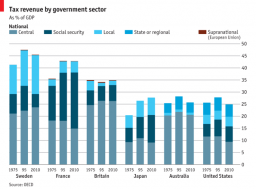
chart27.png (595×441)
Interesting look at how taxes have varied among major industrial countries over the years
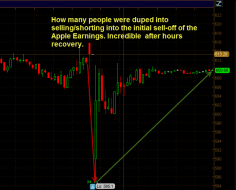
aapl after hours chart recvoery

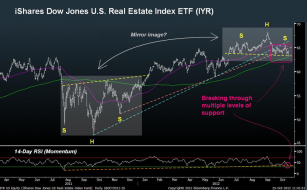
Iyrrealestate
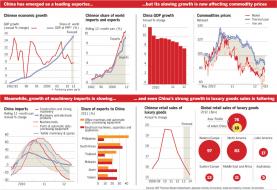
When-China-Sneezes.jpg (975×667)
Chinese economy
crudeoil500indexendofflagoct25.gif (1574×729)
smallcapsrepeat3rdtimeoct25.gif (1574×729)

VXX DAILY 1025.png
VXX: SHORT TERM COUNT

20121024_wagegold.png (720×367)
What is the hourly wage as measured in gold

20121024_election1_1.png (1023×687)
Comprehensive guide to the fiscal cliff and key dates

20121025_AAPL.png (718×366)
The Options-implied skewness expectation of the forward distribution or returns for AAPL - or in English - the low...

Guest Post: The Fiscal Cliff and Demographic Drag | ZeroHedge
The Fiscal Cliff and Demographic Drag

20121024_1987_1.png (719×383)
Comparing 1987 with 2012
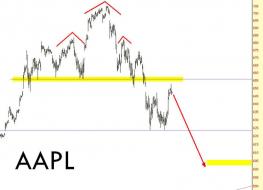
1017-AAPL
Nailed it!
3
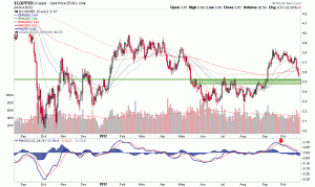
cu
Copper has critical support @ 3.50 -- another inflation tout in trouble.

10 Stocks Sucking Wind

uso
PEAK OILLLLL!!!!!!..... not


1025-CAB
Great trendline example
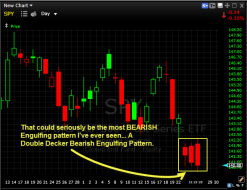
SPY Most Bearish Engulfing Pattern

spx 30 min.png
SPX: SHORT TERM COUNT
dust
A trade in DUST is a very short term option for gold bugs who may not believe the bottom is in just yet.
1
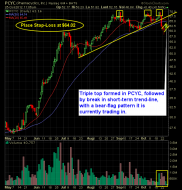
Pharmacyclics PCYC
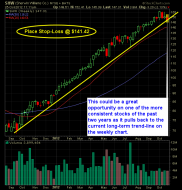
Sherwin Williams SHW
hw
An Hour Of Your Time Has Never Been Worth Less | ZeroHedge
I got your income inequality right here!

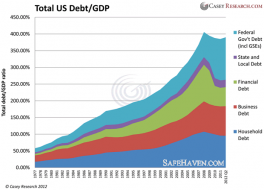
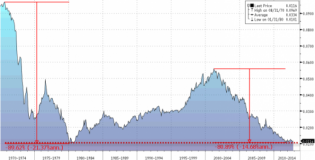
Total US Debt/GDP
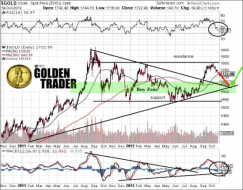
$GOLD (Gold - Spot Price (EOD)) CME

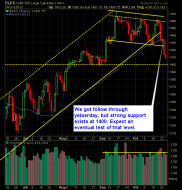
spx 5 min.png
SPX: SHORT TERM BULLISH SET UP

hui
HUI Weekly... does this look bearish to you Beuller?
1
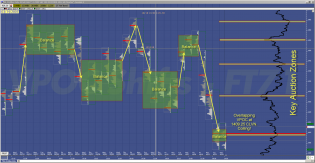
10.25.2012-08.03.48 - FuturesTrader71's library

SP 500 Market Analysis 10-25-12
chart
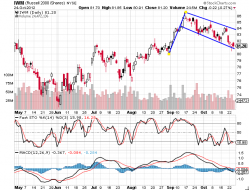
Flag.png
IWM Bull Flag? It looks quite text book. IWM bounced off of the 200 MA 2 days ago and held and looks full of energ...
1

Technical pattern of stock - $CHKP
Now that short to intermediate-term broad market sentiment has convincingly reversed, I am trading the short side...

3

FDAX 60 MIN.png
FDAX: MY SCENARIO

eur 60 min.png
EURUSD: ENDING DIAGONAL ?
SPX: FOLLOW UP OF THE SHORT TERM EWP
SPX: Follow Up of the Short Term EWP | The wave trading
SPX: FOLLOW UP OF THE SHORT TERM EWP