Date: September 11, 2012
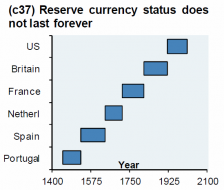
Reserve Currency.png

4
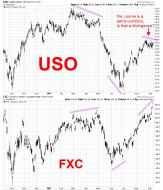
USO FXC divergence September 2012.jpg
USO and FXC diverging when they are correlated 88% of the time

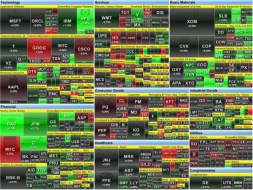
heat-map-9-11


20120911_cliff.png (973×555)
The breathtaking polarization of the U.S. Congress
2

Deron Wagner of Morpheus Trading Group presents at World MoneySh...
Had a blast speaking at the World MoneyShow in Shanghai. Here are a few photos, just for fun...

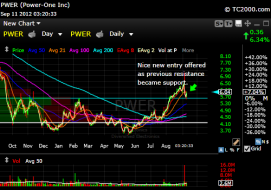
pwer911

QE Timeline


dshort Featured Charts
homeconstructionremainstrongsept11.gif (1576×729)

9-7-12-QE-Chart-SP.gif (750×562)
QE and stocks

83.jpg (938×703)
Treasury yields through various QE rounds

case-shiller6-12a.jpg (545×400)
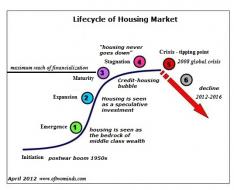
housing-curve.jpg (536×435)
1
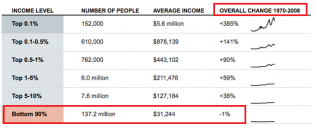
income-disparity8-12.png (545×223)
Cool little table of income levels, average incomes, and growth over the past four decades
3

debt-divide2.gif (475×310)
The growing debt-to-income ratio
1

Labor-share4-12.png (545×327)

income-by-age2-12.gif (545×396)

incomes-real-growth2-12.gif (545×396)

20120911_QE31.png (931×413)
The spread between Par MBS and the 10Y CMS has compressed to near-record lows - implying more than a little expectati...

20120911_EURUSD1.png (685×418)
The action of EURUSD leading up to QE1 and QE2 was positive only to be followed by the more significant sell-off...

20120911_EURUSD.png (720×384)
The Market Is Expecting $850 Billion NEW QE

NFP vs Entitlements.jpg (1025×709)
Five Years Of Jobs Versus Entitlements

20120911_gallup1.png (533×264)

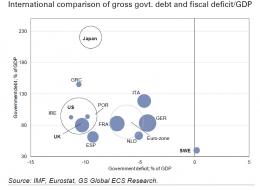
US Debt GDP.jpg (1360×798)
Moody's Warns Of 1 Notch Downgrade If A Bitterly Divided Congress Does Not Begin To Cooperate

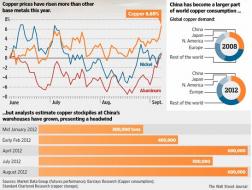
Crude China.jpg (962×633)
Chinese Crude Imports Plunge To Mid-2010 Levels

20120911_AAPLSPYPE.png (722×381)
Apple seems to reverse every time it matches the P/E of the S&P 500
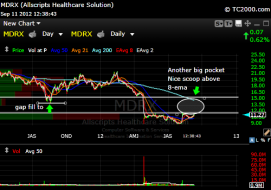
mdrx2
Carbo Ceramics CRR
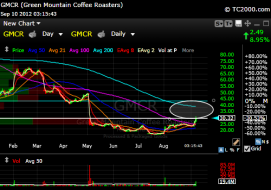
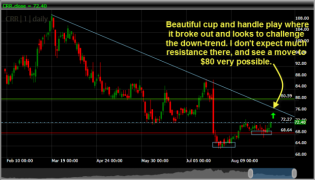
gmcr
g
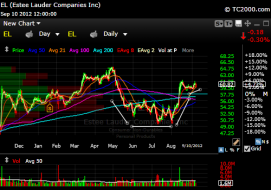
ELday
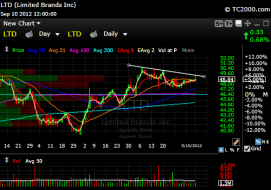
ltd
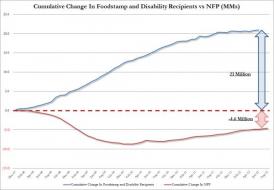
Chart Of The Day: Five Years Of Jobs Versus Entitlements | ZeroHedge

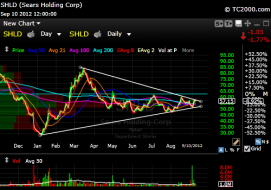
shld
chart
1
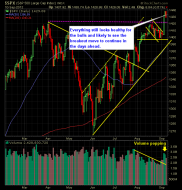
SP 500 Market Analysis 9-11-12
dshort Featured Charts
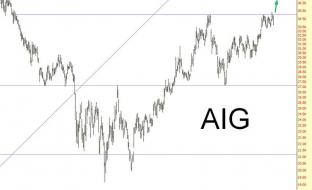
0906-AIG
20120906_comp.png (1081×586)
The Modern World_1.jpg (818×596)
Deck 9:10:12.png

1

ON-AY514_cover0_KS_20120908012730.jpg (800×800)

2012-08-07_1124 - chartwiz's library

6

US GDP 2050.jpg (1168×849)

US deficit august.jpg (829×459)
US August Budget Deficit Soars To $192 Billion, $1.17 Trillion In Fiscal 2012

Obama deficit.jpg (1160×586)
US August Budget Deficit Soars To $192 Billion, $1.17 Trillion In Fiscal 2012

Shrinking Dollar Infographic
US dollar infographic

20120910_volume.png (620×376)
If the U.S. equity market is such a good party, why is the dance floor so empty?

The Difference Between Apple & Amazon In One Chart
The Difference Between Apple & Amazon In One Chart
SPX: FOLLOW UP OF THE SHORT TERM EWP
SPX: Follow Up of the Short Term EWP | The wave trading
SPX: FOLLOW UP OF THE SHORT TERM EWP
