Date: September 16, 2012

USDCAD 5 MIN.png
USDCAD: A LARGER REBOUND MAY ALLOW AN EURUSD PULLBACK

slvslwatresistancesept11.gif (1558×660)
1
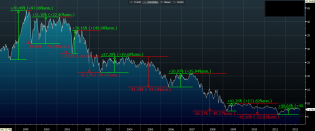
091512 tlt daily pitchfork trendlines.gif
TLT - Confluence of pitchfork and trendlines

The Official Dilbert Website featuring Scott Adams Dilbert strip...
Dogbert Celebrity investment


cdn.socialtrade.com/comsys..._gzUlA9_m.png
MCP Breakout Imminent...
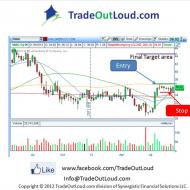
Active Investor Weekly Signal Newsletter
Set-up: base break out of weekly chart
Strategy: LONG over $36.50 area, stop under $34.50 Target areas: 37.50, 3...

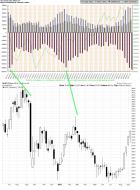
SLV vs. COTs September 2012.jpg
SLV vs. the COTs. Managed rise if you ask me.


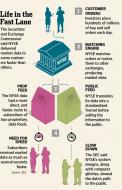
DEBT BROTHER IS WATCHING YOU

PROTESTOR

Spain Redemptions.jpg (816×543)
Spain=hosed
P1-BI126_NYSESE_G_20120914180609


7983333585_78b0fe8007_b_JETv8v_m.jpg (640×418)

Evil Plan 83.0..........
There She Blows!!!
There She Blows!!!...................Evil Plan 83.0 (by BDI) - S...
Evil Plan 83.0..........
There She Blows!!!

20120916_beta.png (1036×585)
Real effect of LSAPs is to suppress the signaling effect of macro data from the real economy

SharePlanner Reversal Indicator 9-16-12

chartoftheday_604_How_iPhone_Announcements_Affect_Apple_Stock_b.jpg
how iphone announcements affect apple stock
http://www.statista.com/topics/870/iphone/chart/604/how-iphone-announcem...


20120915_wom913.png (595×714)
The war in Syria
1
20120915_chart2.png (1556×649)
Real value of the Dow Jones Industrial Average from 1999 to Present (real = adjusted for the value of Gold)
3

20120915_chart1.png (1177×619)
Real value of the German stock market from 1914 to 1927
1
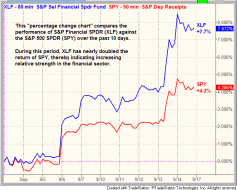
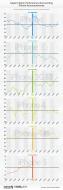
Relative performance of $XLF vs. $SPY over the past 10 days
The Best Financial ETF To Buy For Short-Term Trading ($KRE, $XLF)

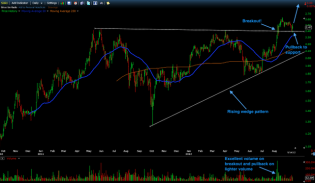
2012-09-16-PROPHET.png
Triangle breakout at $30. Per Bulkowski, upward breakout target at 84% of triangle height. Target $46.4.

Trading Blues: SIRI update....Nice Pullback
SIRI pullback

sentiment.gif
SENTIMENT IS UP
