Date: December 12, 2013

IWM DAILY.png
$IWM: Inside Day is suggesting a likely oversold rebound


USDJPY 120 MIN ED.png
$USDJPY: So far is not suggesting Risk Off

20131212_citi13.jpg (1124×716)
CitiBank's predictions for 2014

20131212_house1.jpg (588×348)
Global House Price Index Surges To Record High
1

20131212_QE_3.jpg (1869×945)
How The "QE Economy" Works (And Why It Doesn't) In One Giant Flowchart

hungryplanet
It Would Take 4.4 Earths To Sustain A World Full Of Americans
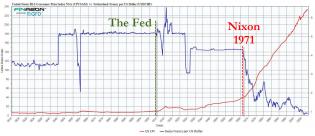
20131212_Fed1.jpg (1268×548)
200 Years Of Dollar Debasement
2

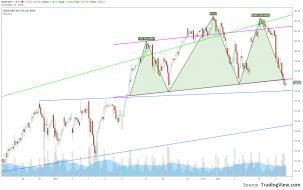
20131212_RTY.jpg (962×501)
Is This The Chart That Has Small Cap BTFATH-ers Nervous?
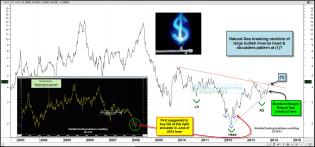
natgasnecklinebreakoutdec12.jpg (1568×735)
Bullish Neckline breakout of multi-year head & shoulders for natural gas

spydojistaratresistancedec9.jpg (1568×734)
Did a “Bearish Candlestick Reversal” pattern just happen in S&P 500?
1
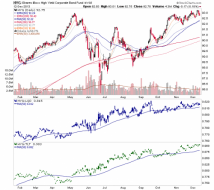
hyg
Junk bonds and ratios to investment grade and T bonds are bullish divergence for the market.


CL 60 MIN.png
$NDX: Maybe price is forming an H&S

ndx 60 min.png
$NDX: Maybe price is forming an H&S

EUR 60 MIN TZZ.png
$EURUSD: Follow up of the s/t count

2013-12-12_SPX-5Year.png
Old SPX resistance becomes support, for now.
2

SPX 120 MIN ABC.png
$SPX: Considerations regarding the current EWP
1
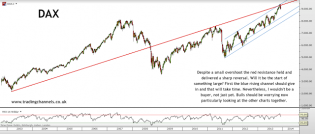
Trading channels: Bears getting excited
Ze German index reversing

1

Trading channels: Bears getting excited
Crude oil bulls careful !
1

thenewglobalinvestor.com/w...-praying.jpeg
I know Ben...you want RUT 900 just as badly as I do. Glad we're on the same page.

2
StockTwits® - Share Ideas & Learn from Passionate Investors & Traders
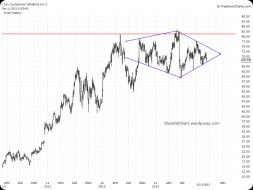
Diamond cracks

1
spyhrly_12122013.png
Wonder if this is a possible SPY H&S pattern that will play out to a downside target of about 175?


content.screencast.com/use...SPX121213.jpg
$SPX hourly chart
$SPX breaking down from topping pattern.
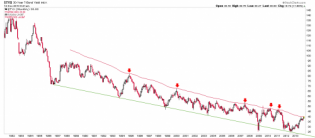
tyx
A reminder - in the shadow of FOMC - that the 30 year yield is at a reversal point defined by decades. Expect mos...

1.bp.blogspot.com/-_2HZ9IM...211_bulls.png
Highest bullish sentiment since 1987.
1

SPX 15 MIN.png
$SPX: Tentative follow up of the s/t EWP
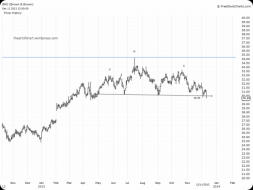
bro
Brown & Brown