Date: December 13, 2013
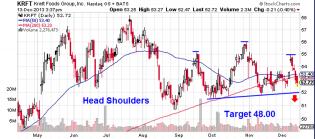
KRFT.jpg
Picture
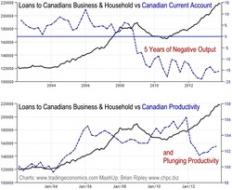
This 4-chart mashup (5 charts in total actually) looks at Canadians (households and business) continuing to vigorousl...

spx_12132013.png
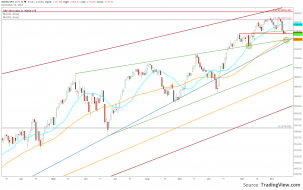
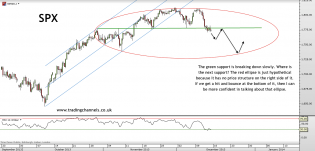
SPX daily looks to be below a potential HS, but above a support level at 1775.22. Assuming price continues downwar...

2
REV.jpg
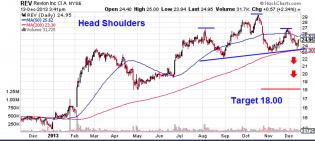
REV: Head Shoulders

2

content.screencast.com/use...SPX121313.jpg
$SPX hourly chart
What was support, is now resistance.


spx
Critical resistance for S&P 500 shown on chart...

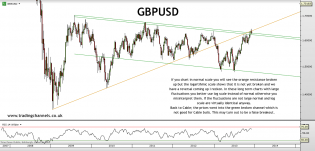
Trading channels: Bears have a chance here
Turning bearish on Cable

Trading channels: Bears have a chance here
Bears have a chance here
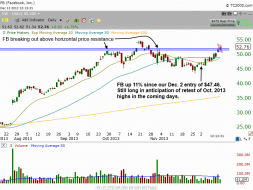
FB.png
$FB broke out above horizontal price resistance. Should soon test its Oct. 2013 highs.


1929-analog_5YXVws_m.gif (600×345)
1929/2013 analog
1
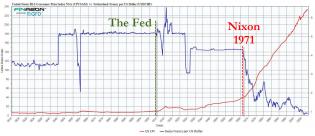
http://www.zerohedge.com/sites/default/files/images/user3303/imager...
200 Years Of Dollar Debasement

2
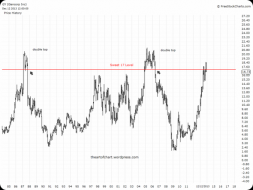
GYm
Sweet Seventeen


SPX WEEKLY.png
$SPX: Weekly chart is looking bearish (For the s/t)

3
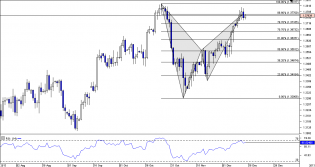
chart_eur_usd_daily_snapshot.png (1101×585)
EURUSD completing and respecting harmonic bat pattern
