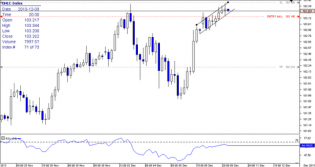
Log In
|
Create Account
Chart
Chart Lab
Drawn Objects
Guide to Patterns
Mobile Charting
Modes
Power Features
Reference Manual
Rotation Graphs
SlopeCharts
Video Guide to SlopeCharts
Equities
Biggest Companies
Correlations
Earnings
International Equities
Logo-Based Calendar
Real-Time SlopeAlerts
SlopeMATRIX
Super Summary
Today’s Movers
Woulda Shoulda
Markets
Commodities
CryptoStream Live
Economic Database
End-of-Day Report
Macroeconomics
Market Meter
MetaSymbols
SlopeRules
The Matrix
Yield Curve Tool
Options
Backtest Strategies
Chain Quotes
Earnings Reactions
Options Analytics
Payoff Analyzer
Strategy Explorer
Trading Strategies
Virtual Trading
Volatility Calendar
Volatility Matrix
Read
Best Posts of All Time
Books by Tim Knight
Comments Search
Guide to Comments
Latest Posts
Mobile Apps
Profile of Your Host
Recommended Books
SlopeBot GPT AI
Watch Slope Videos
Social
Activity Feed
Browse Chart Database
Guide to SocialTrade
Hall of Fame
Members Directory
Published Watch Lists
Publishing/Subscribing
Search SlopeRules
SlopeTalk LIVE
Virtual Trading
Help
Best Pages For You
Guide to the Site
Membership Levels
Pattern Video Library
SlopeCharts Reference
SlopeMatrix Guide
SlopeRules System Builder
SlopeTiles Customization
Using SlopeTalk
Video Guide to Slope
Log In
Create Free Account
Memberships
Date
:
December
9, 2013
spydojistaratresistancedec9.jpg (1568×734)
Did a “Bearish Candlestick Reversal” pattern just happen in S&P 500?
1
SPX 60 MIN.png
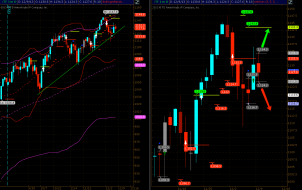
$SPX: Follow up of the s/t EWP
1
$USDJPY trade scenario - 4h Wedge with daily double top create n...
evilspeculator.com/wp-cont..._TF_setup.png
I'm ok with Mole's setup on /TF here, with one caveat. I'd be long /TF above 1137, short below 1124.
2
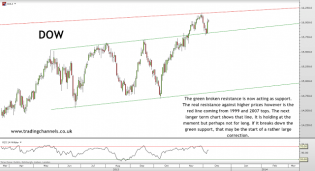
Trading channels: Dow is stuck...for now.
DOW is stuck for now.
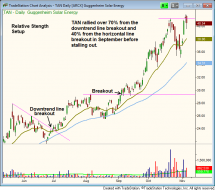
$TAN stock chart - relative strength breakout follow-through
New overview of my stock and ETF swing trading strategy: http://bit.ly/IYl2KV
content.screencast.com/use.../RUT12913.jpg
$RUT 30 min chart Corrective trendline breakdown this morning. Need to first take out last week's lows around...
1
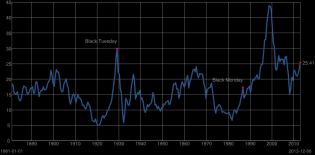
Shiller PE Ratio Chart
When I look at this chart I see three zones. P/E < 10 = Super Value, Mortgage the House and Farm and Buy P/E <...
1
The Slippery Slope Investment and Chuckle Forum
I post this chart to say that I just don't buy it. I know Tim loves analogs with the past, but as they say, past p...
3