Date: January 17, 2013

dshort Featured Charts

Screen+shot+2012-12-04+at+3.39.46+PM.png (1071×763)
1
2013-01-17_1333 - chartwiz's library
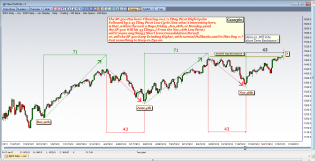
Joe's pretty chart.
SP-500 High/Low -Cycle Chart: Will 43TDay (Jan,21 +/- 1 T-Day) Mean anything ?


spx 30 min.png
SPX: welcome to the jumble wave counting

eurosendingsignalforsilverjan111.gif (1574×728)
slwhiyoawayitgoesjan10.gif (1573×728)

appleeiffelcountertrendrallyjan162.gif (1573×728)

Social Security Cliff in Sight
Social Security Cliff in Sight

innervoice-e1357971514904.png (525×3364)
Why Most People Fail at Trading
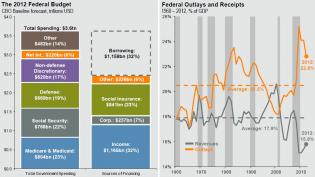
federal-budget.jpg (1094×616)
The 2012 Federal Budget

M2-velocity11-12.png (545×327)
The velocity of this money is essentially zero: it goes nowhere and does nothing to stimulate demand. If we print...
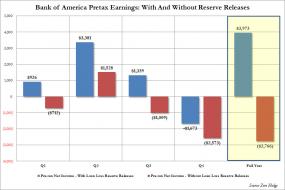
BAC earnings 1.jpg (961×639)
So what happens when one strips loss reserve releases from the Net Income? Well, the full year Bank of America Per...

GDP.png (484×803)
How Many Central Banks Does It Take To Generate 1% GDP Growth In 5 Years?

20130116_debtceiling.jpg (1258×687)
Debt Ceiling 2011 Vs 2013 Compare And Contrast

spx 15 min.png
$SPX: Since the ED is dead I have to work with this new count
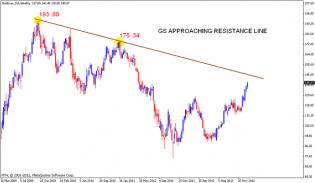
Goldman Sachs Chart analysis | Nifty charts and latest market updates
Goldman Sachs resistance line


SPX 60 MIN ED Y.png
$SPX: The old ED is dead but a new one could be forming

Housing Starts SA vs NSA.jpg (825×556)
Chart Of The Day: Housing Starts Adjusted vs Unadjusted
household-income-monthly-median-since-2000

united_states

spx 15 min.png
$SPX: Ending Diagonal project is being jeopardized
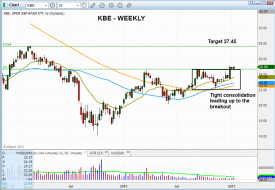
Technical pattern of stock - $KBE
Why SPDR S&P Bank ETF ($KBE) Is Ready To Surge Higher


GOLD 30 MIN.png
$YG_F Gold Future: Follow up of the st EWP
SPX: FOLLOW UP OF THE SHORT TERM EWP
SPX: Follow Up of the Short Term EWP | The wave trading
SPX: FOLLOW UP OF THE SHORT TERM EWP