Date: January 23, 2013

ES 15 MIN.png
$ES_F (Globex): The internal structure of the pullback suggests more upside


OIL 15 MIN.png
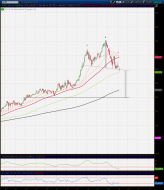
$CL_F (Oil): A correction has been kicked off
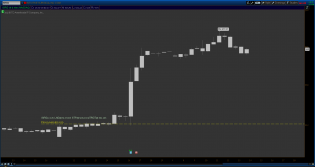
Fun with Fibonacci
Spy Fibonacci inside TPOprofile is very interesting.

1.gif
LEADERSHIP

content.screencast.com/use...4/DB12313.gif
DB looks excellent from the short side here. Should outperform on the short side.

Screen Shot 2013-01-19 at 8.46.34 PM.png

3

20130123_bill2.jpg (1008×606)
The real-time billionaire tracker maps the world's richest people to their country of citizenship, industry, gende...
2

gldfacingenemyjan23.gif (1575×727)
Gold's key enemy that has kept if from moving higher over the last 18 months is? A lack of buyers at the top of i...

oil 60 min.png
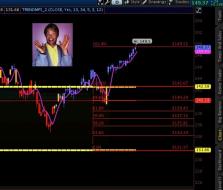
$CL_F (Oil) : A top should be in place

VIX DAILY.png
$VIX: Yellow flag for the bulls = Potential Double bottom
2013-01-23-ISRG.png


JO 15 MIN.png
$JO: Follow up of the Inverted H&S scenario. The short term pattern looks appealing

ndx 15 min.png
$NDX: As long as today´s gap is not closed maybe this pattern could pan out
SharePlanner Reversal Indicator 1-23-13

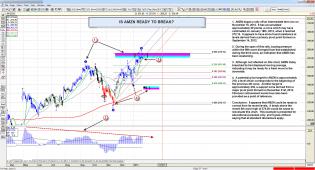
amzn.jpg
S and P 500 Market Analysis 1-23-13

pharma.jpg (904×648)
Pharmaceutical Spending Per Capita

Spain Q4 GDP.jpg (827×498)
Spanish Q4 GDP Declines At Fastest Pace Since 2009

Fed Intervention Days.jpg (657×1146)
We have compiled the data: of the 1519 total days since that fateful Tuesday in November 2008, the Fed has intervened...

A History of Gold Infographic
A Visual History Of Gold

20130122_VIX1.jpg (1276×664)
Are We In A New VIX Regime?

QID DAILY.png
$QID: Maybe this count could pan out

ndx 60 min.png
$NDX: Ending pattern in sight ?

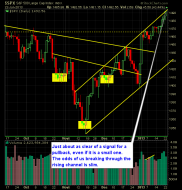
ES 15 MIN.png
$ES_F (ES Globex): short term pattern suggests one more up leg

JO DAILY.png
$JO: MAYBE AN INVERTED H&S
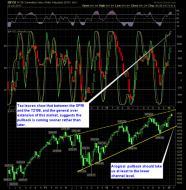
SPX:FOLLOW UP OF THE SHORT TERM EWP
SPX: Follow Up of the Short Term EWP | The wave trading
SPX:FOLLOW UP OF THE SHORT TERM EWP