Date: July 1, 2013
$NASI
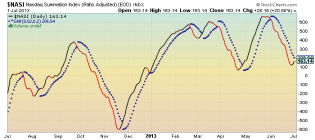
NASDAQ Summation Index with Parabolic SAR (7/1/13)
The Nazzie is close to flipping to the long side as well.

$NYSI
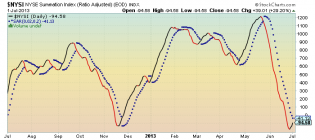
NYSE Summation Index with Parabolic SAR
Close to flipping to a long signal.
content.screencast.com/use...d/RUT7113.gif
At the risk of sounding like an Elliot Waver, I'm going to extend this out a bit... lol. Please no letters or ema...

http://content.screencast.com/users/Jim_Nf6/folders/Jing/media/a42d...
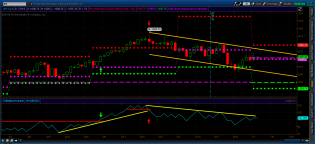
SP 500 e-mini futures with monthly and quarterly Person's Pivots (7/1/13)
On Balance Volume is trending down.
http://content.screencast.com/users/Jim_Nf6/folders/Jing/media/7ee3...
SPY daily with monthly and quarterly Person's Pivots (7/1/13)
Today's shooting star at the monthly and quarterl...
1
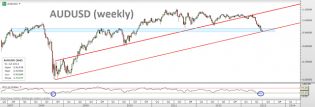
Trading channels: Aussie dollar only
Aussie dollar only


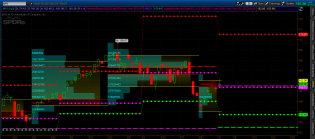
SPX 15 MIN.png
$SPX: If price is unfolding an ED wave (C) the wave (II) must be in place

2

TLT 15 min ed c.PNG
$TLT: If price is forming an ED it could have a bearish outcome
2

XLF DAILY.png
$XLF: So far the daily Shooting Star could threaten troubles ahead
1

SPX 15 MIN ED C.png
$SPX: Bulls so far have a problem with the gap.If it is not solved ......
5
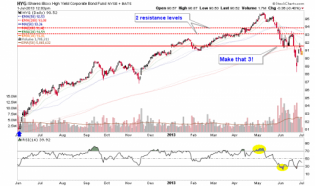
hyg
Junk bonds (ultimate 'RISK ON') are negative today & that's a neg. divergence to the market.

3

SPX 15 MIN.png
$SPX: Bullish short term set up with a potential target in the range 1642-1665
1
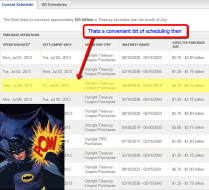
POW3.png
For anyone who hasn’t noticed, the biggest day for asset purchases in July, under the tentative POMO schedule is...

1
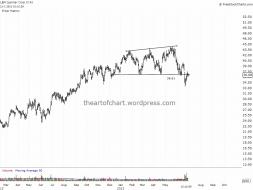
len.jpeg
Broadening Top breakdown

1