Date: May 31, 2013
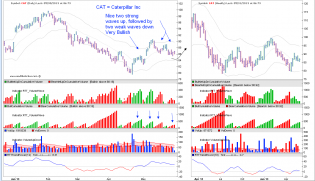
CAT

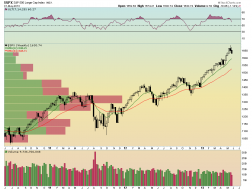
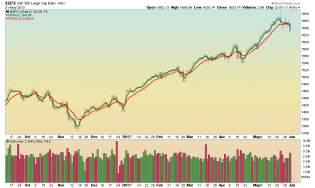
$SPX
SPX weekly with 10 and 34 EMAs (5/31/13)
The long term trend remains bullish. There is a lot of air between the...

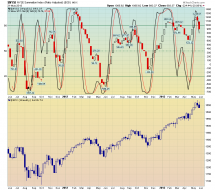
$NYSI
NYSE Summation Index weekly with slow stochastic (5,3) (5/31/13)
The stochastic signal has crossed and is below...
$SPX
SPX daily with 3 and 10 EMAs (5/31/13)
The 3 day EMA has crossed the 10 day EMA and we have started a short ter...
1

20130531_BTFD3.jpg (719×386)
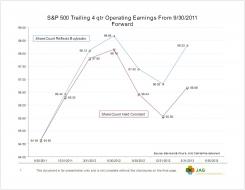
Price/earnings and economic divergence
5

20130531_EOD1.jpg (699×382)
Dow Dumps 270 Points Intraday To Biggest 2-Week Drop In Six Months
1

SPX 15 MIN.png
$SPX: Bears need more traction to the downside


spx 5 min.png
$SPX: So far the pattern from yesterday´s hod remains impulsive

SPX 15 MIN.png
SPX: Another option for the DZZ count:
PDF file of "The Bigger Picture" - by Finance Innovation Lab
thefinancelab.org/wp-conte...r_picture.pdf
PDF file of "The Bigger Picture" - by Finance Innovation Lab


EUR DAILY.png
$EURUSD: The DZZ off Feb 1 high is on track

VXX 60 min tr.png
$VXX: Maybe price is forming a bullish Triangle wave (B)
Chart
Okay, so a big cut of the "earnings" are from stock buybacks. Where's the chart that shows how much of earnings i...


spx 5 min.png
$SPX: Possible impulsive down leg. Confirmed if it is followed by a 3-wave bounce
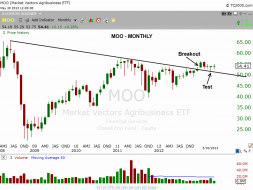
$MOO monthly chart
Agriculture ETF Starts Sprouting, As Solar ETF Still Shining Brightly. See full analysis here: http://blog.morpheustr...

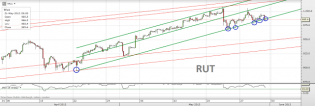
Trading channels: RUT's sixth hit and GOLD
RUT's sixth hit on the lower band and GOLD
