Date: November 11, 2013

20131112adxy.png
ADXY rolling over again, but still no breakdown yet. ADXY is 36.9% CNY, 11.8% HKD, 11.6% KRW, 11.5% SGD, 9.2% INR.


Picture
1
This is an interesting discussion about what is happening in China and the potential consequences. I am using the Bookmarklet tool on an entire newsletter. Hopefully...
112013-BNB-November.pdf
This is an interesting discussion about what is happening in China and the potential consequences. I am using the...

1

$COMPQ daily 11.11.13.png
This is a beautiful chart .....to me. Time will tell what it means. Please see comments on chart. TB

1

USDJPY.png
$USDJPY: Follow up of the s/t count


S&P-500-Earnings-Deviation-111113.PNG (960×584)
The following charts are measures of deviation from underlying trends or averages. The greater the deviation from...

Margin-Debt-AsPct-GDP-111113.PNG (1026×553)
Since the stock market should be a reflection of the underlying economy, then the amount of leverage, or margin de...

S&P-500-MarketCap-GDP-111113.PNG (841×468)
One of Warren Buffet's favorite valuation measures is Market Cap to GDP. I have modified this analysis utilizing...

S&P-500-GDP-111113.PNG (909×543)
Are stocks truly reflecting the economy?
1

PE-Deviation-111113.PNG (927×527)

Crestmont-PE-11113.PNG (914×698)
Ed Easterling, Crestmont Research, has done extensive studies on valuation and resulting long term returns.
3

Tobins-Q-Shiller-PE-111113.PNG (1024×656)
The following chart shows Tobin's "Q" ratio and Robert Shillers "Cyclically Adjusted P/E (CAPE)" ratio versus the...

John Hussman Asks "What Is Different This Time?" | Zero Hedge
1. S&P 500 Index overvalued, with the Shiller P/E (S&P 500 divided by the 10-year average of inflation-adjusted ear...
1
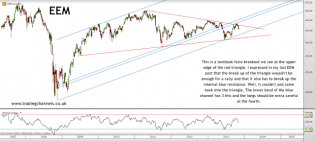
Trading channels: Consolidating charts
Emerging markets failed to re-emerge.


VXX DAILY.png
$VXX: An impulsive decline off the Oct 9 high is almost done
1

VIX DAILY.png
$VIX: Double Bottom ?

miss-airport-calander.jpg
Miss Airport Calendar

2
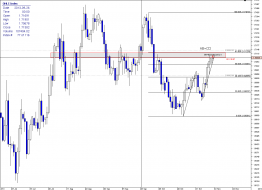
Market Zone | Technical analysis for short setup on GBPAUD: The...
AB=CD sell pattern on the daily chart. Small Wedge on the 4h chart

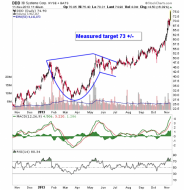
ddd
A big 'Cup' of over valued, 3D Systems at a P/E of 58 and a P/S of nearly 16? DDD is through target today. Where...


20131111_rich.jpg (555×398)
The ultra-rich have never had it better.
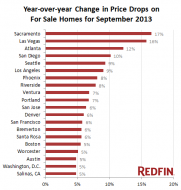
redfin price drops
There are price drops, but probably from dramatically higher asking prices than a couple of years ago. The bump u...

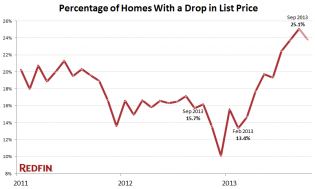
price drops
The Sellers' market beginning to lose its grip?

JPM (Weekly) _ XLF (Weekly) 50_2009 - 45_2013
$JPM - weaker than XLF. If XLF will reverse direction, JPM could be the best stock to short. You can also see Week...

ndx 60 min.png
$NDX: If the current up leg is countertrend is should top < 3389.20

XLF 15 MIN.png
$XLF: Probably the most watched etf today

GLD 15 MIN.png
$GLD: It could be aligned with the EUEUSD DZZ count

EURUSD 120 MIN.png
$EURUSD: Follow up of the s/t EWP