Date: November 12, 2013

eur 60 min.png
$EURUSD: Alt s/t scenario


EUR 5 MIN.png
$EURUSD: Follow up of the s/t EWP
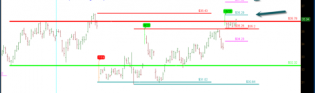
image.png
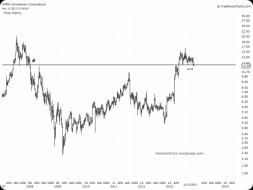
More Bearish Charts SBUX and IBM

image
SPX and ES update.
1

bubbles.jpg
Fed Bubble


Trading channels: Is topping a process?
Is topping a process?

cdn.socialtrade.com/comsys..._IaHKyG_m.png
Gold long-term support

1

eur 60 min.png
$EURUSD: Follow of the count off The October high

SX 60 MIN.png
$SPX: The Triangle idea
1

spx 5 min.png
$SPX: Not clear yet if the decline is corrective or impulsive

USDJPY 15 MIN.png
$USDJPY: Key time (Make it or brake it) for the Triangle scenario
1

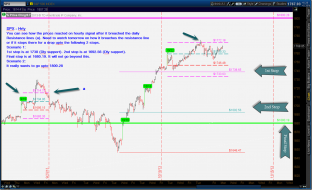
spx 5 min.png
$SPX: lower high + lower low The probability of a corrective phase is increasing

Japanese Yen ETF decline
2 ETFs To Buy Now That Don’t Care About A Weakening Stock Market: http://blog.morpheustrading.com/3404


uso
Crude oil to support, switching to long from short.


intc
INTC big picture measures to 44 (believe it or not) if noted resistance is taken out.

csco
CSCO still on its wedge breakout.
StockTwits® - Share Ideas & Learn from Passionate Investors & Traders
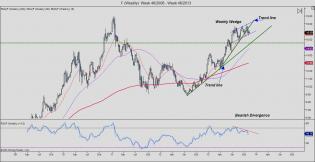
$F weekly chart analysis - Wedge pattern on the weekly charts suggests 2 trading scenarios

immrw
Haptikos
