Date: November 15, 2013

joefridaynyseforrestimportantresistancenov8.jpg (1569×738)
NYSE attempting to break this “Double Top!”
1
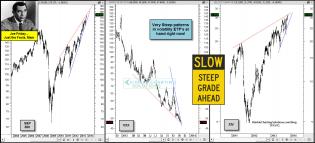
joefridaysteepvolatilitypatternsnov15.jpg (1567×715)
Steep Patterns at hand in these Volatility ETF’s!
1

1030yrresistancenov143.jpg (1566×712)
Can Yellen make interest rates act the same as Ben did here?

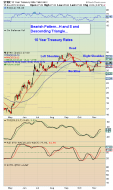
nasd10yryldresistancenov13.jpg (1564×688)
Nasdaq and yields hit multi-year resistance, Dumb money at extremes!
1
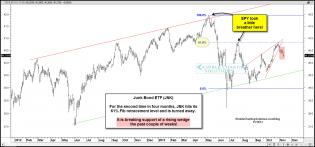
jnkbreaksupportbelowfibnov121.jpg (1569×736)
Junk Bonds break support after hitting important Fibonacci resistance!
1

veteransdaybreakoutsnov11.jpg (1560×687)
S&P 500, NYSE & Nikkei index attempting multi-decade breakouts!

20131114_debt.png (1440×2560)
The History of Debt
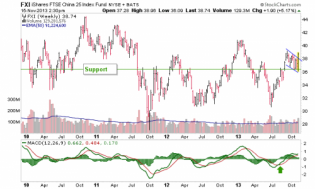
fxi
China 25 breaking consolidation flag above support.

Google Reunion Vid Is Bringing People to Tears
Google Reunion Vid Is Bringing People to Tears | The Art Of Chart
Google Reunion Vid Is Bringing People to Tears


The Holy Grail In Trading
If You’re Seeking The Holy Grail In Trading, You Are Wasting Your Time. Here's Why: http://blog.morpheustrading.com/3427

2

DOW 5 MIN.png
$DOW: H&S ?

1

spx 5 min.png
$SPX: Watching if the small wedge establishes a s/t top

VIX 60 MIN .png
$VIX: The potential bullish falling wedge
sc.png
From Michael Pitre. Head & Shoulder top a possibility.
TNX has more than doubled from its July 2012 low.

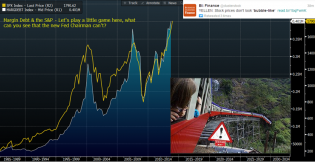
Margindebt15.11.2.png
no further comment required

2

ES 15 MIN.png
$ES_F (Globex) I am watching if price concludes a 5 wave overlapping structure

VXX DAILY.png
$VXX: The wedge will it break or will it pan out ? #vxx #elliottwave

USDJPY D TR X.png
$USDJPY: I interpreted the wrong triangle