Date: November 16, 2013

QE Queen.jpg
QE Queen rules with paper fist.

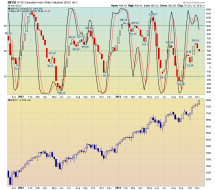
nasx.png
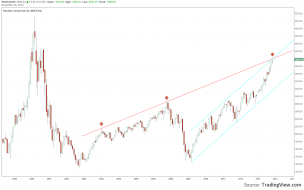
With the bullish action across all indices, I noticed a trendline resistance and channel top about to be crossed o...

2
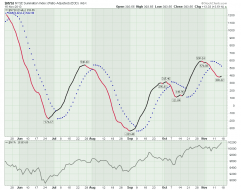
$NYSI
NYSE Summation Index daily with parabolic SAR (11/15/13)
The NASI has turned up, which is bad for bears.

1
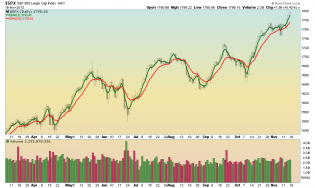
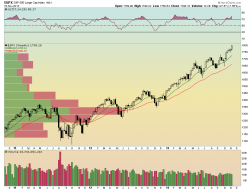
$SPX
SPX daily with 3 and 10 EMAs (11/15/13)
Wow! My short term puts got killed last week.
$NYSI
NYSE Summation Index with slow stochastic (5,3) (11/15/13)
Hope for the bearishly inclined - The NASI stochasti...
1
$SPX
SPX weekly with 13 and 34 EMAs (11/15/13)
This chart echoes Tim's post. Since May of 2012 we have not had more...
1