Date: November 20, 2013

DOW 5 MIN.png
$DOW: This decline is corrective

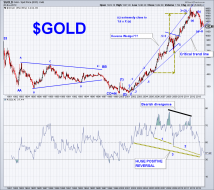
GOLD monthly 11.20.13sc.png
Gold time for boom or bust??? Please see comments below. This is a monthly log chart.

3

death.jpg (2305×2000)
This is how we die now…
1
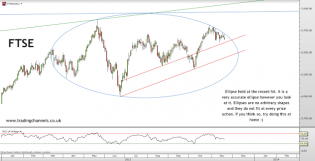
Trading channels: DOW starting to look weak
A perfect ellipse still holding


Trading channels: DOW starting to look weak
It's raining gold at these prices. What happened to the news saying China demand quadrupled and India demand tetratup...
2

content.screencast.com/use...Summation.png
McClellan and Summation look great here for the bear case.


SPX 15 MIN.png
$SPX: A reversal requires an impulsive decline
2
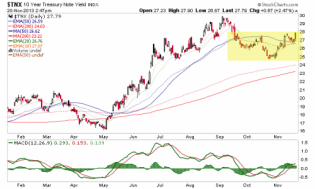
tnx
10 year yield w/ a bullish pattern.

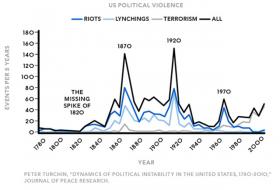
Blame Rich, Overeducated Elites as Our Society Frays - Bloomberg
A historical perspective on inequality.

2

USDJPY 60 MIN.png
$USDJPY: It could be forming a Triangle wave (B)

bitcoin.png (502×405)
Bitcoin
1

SPX 60 MIN.png
$SPX: If yesterday´s lod holds price could be forming a Triangle
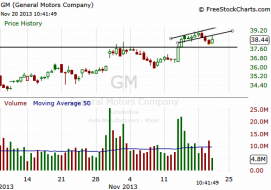
Short setup on GM:
The stock opened the day strong and touched...
Perfect pull back to broken wedge. Short setup


nikk.yen
Japan breaks 2 symmetrical triangles.
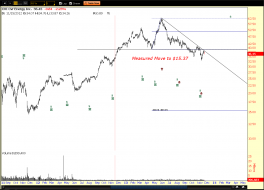
CVI_Short_trade.png
Incredible measured move, but who knows in this market?

3

SPX 60 MIN DZZ.png
$SPX: Follow up s/t count Option 2 (Not expected by the majority)
1

SPX 60 MIN ZZ.png
$SPX: Follow up s/t count Option 1 (Followed by the Majority)

eur 60 min.png
$EURUSD: Follow up of the s/t count
1