Date: November 21, 2013

CL 30 MIN.png
$CL: Follow up of the s/t count (Bullish

20131121_EOD11.jpg (903×499)

1

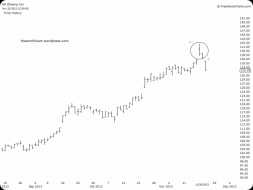
USO DAILY.png
$USO: The pattern from the September 6 high suggests a potential large rebound
1

NDX DAILY.png
$NDX: It could be forming a bearish rising wedge
1

USDJPY 5 MIN.png
$USDJPY: Maybe this Ending Diagonal could pan out
IIBears_2013_11_21.png (829×606)
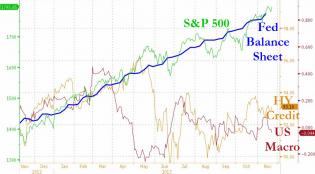
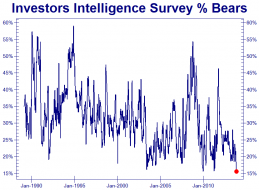
The Scariest Chart For Stock Bulls Ever
2
sc.png
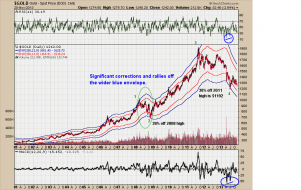
From Robert Cote. Trading Bands on Gold chart.

1

Trading channels: Rising channels getting exhausted
Oil bottoming ? Perhaps not so soon.

3

SPX 60 MIN.png
$SPX: It is obvious that the pattern off the October lows is not done yet
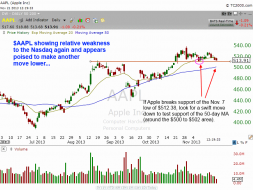
aapl.png
$AAPL relative weakness again today...flat while $QQQ +0.7%


spy.gld
SPY vs. GLD measurement. Anticipate macro changes at that point.

ba2
Why Flying Boeing Is Scary

1

FDAX DAILY.png
$DAX_F: It could forming a Rising Wedge

SMH DAILY.png
$SMH: Potential bullish set up

USDJPY 15 MIN.png
$USDJPY: The thrust following a Triangle wave (B)

ndx 15 min.png
$NDX: This is a corective decline
burn the evidence.jpg
