Date: November 22, 2013

dshort Featured Charts
How This One Chart Proves Economic Recovery Is Fake
1
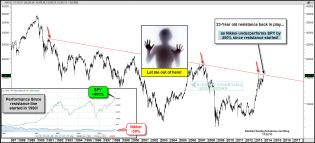
nikkei23yearresistancenov22.jpg (1569×715)
World’s most wicked resistance line going to give way after 23 years?

joefridaytltsupportnov221.jpg (1569×737)
Huge bond ETF needs to hold here!!!
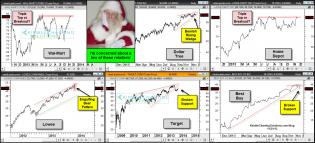
retail6packcloselooknov211.jpg (1561×710)
Hey Santa….I’m concerned about what I see in Retail!

nysefollowwilshirenov20.jpg (1565×692)
Is the NYSE about to do what the Wilshire just did?

worldmarketsattemptingbreakoutsnov19.jpg (1567×687)
Key world markets all attempting breakouts…at the same time!

Beveridge Curve_1.jpg (1328×931)
The Time To Hike Rates Is Now According To The Beveridge Curve

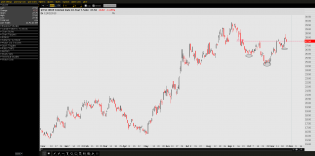
20131122_EOD4.jpg (959×478)
S&P Closes Above 1800, Posts 7th Consecutive Weekly Increase: Longest Streak Since 2007
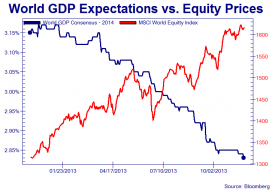
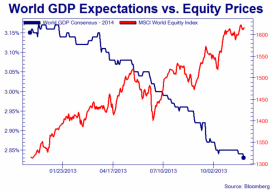
WGDP_2013_11_22.png (726×507)
Behold The World's Real "Death Cross"
2

BitcoinvBank.jpg (1023×1186)
Bitcoin Or A Bank? Here's How They Stack Up
1

dshort Featured Charts
The 30 year Bond price and yield over the last 20 years. Bounce in price coming or significant trend break?


Condo Game
"Downtown condos are "more a commodities play than a housing market". Charles "King Cobra" Hanes, condo broker. Al...

WGDP_2013_11_22_0.png (600×419)
For Rosa

1
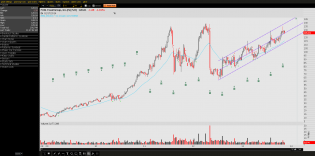
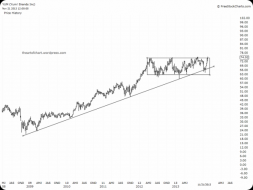
FOSL-2013-11-22-PROPHET-5YWeekly.png
FOSl 5year Weekly

TNX-2013-11-22-PROPHET.png
TNX interest rates ..

SPX 120 MIN.png
$SPX: This up leg does not look impulsive = 2 options

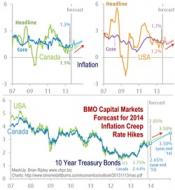
BMO Rate Forecast
BMO Capital Markets Economic Research released their North American Outlook (Nov 13, 2013) which included a foreca...
s.wsj.net/public/resources...122063646.jpg

2
yum
Are You A Junk-Food Junkie?


USDJPY DAILY.png
$USDJPY: Forming Evening Doji Star ?