Date: November 27, 2013
dow.jpg
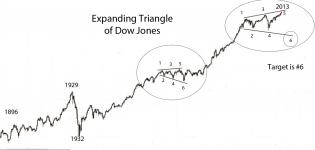
Dow Jones

1

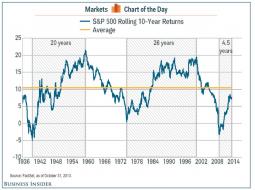
stocksinflationadjustedbragrightsnov26.jpg (1059×600)
Buy stocks for growth/to beat inflation? Not much to brag about!

stockbondspreadnarrownov26.jpg (1568×737)
This spread has helped portfolio construction-Fed goofed it up for good?

sp5001929levelnov252.jpg (1098×530)
Interesting Fibonacci extension
1

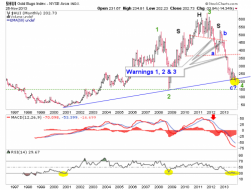
Margin Debt Oct 2013.jpg (1152×709)
Margin Debt Soars To New Record; Investor Net Worth Hits Record Low
1

20131127_bubbles.png (1287×1425)
The bitcoin bubble
2
Guest - 1929 Analog | Notes From the Rabbit Hole
Current Dow comp'd w/ 1929, from Tom McClellan.

4
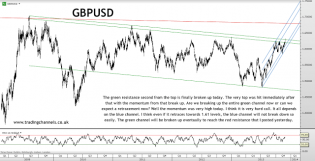
Trading channels: Bulls still raging
Cable looking good.

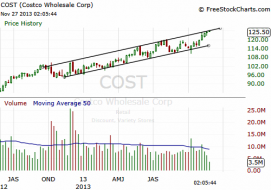
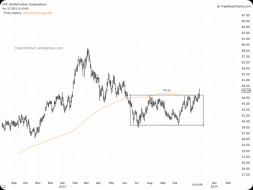
The Market Zone | $COST touched the upper trend line of a weekly...
$COST testing a weekly trading channel. Yesterday's candle ended as a Pinbar after touching the channel


USDJPY 60 MIN.png
$USDJPY: Guessing an Ending Diagonal


SPX 60 MIN.png
$SPX: Maybe finally some clarity
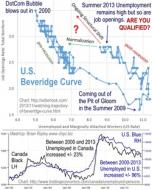
Beveridge Curve 2000-2013
This chart mashup shows the Beveridge Curve which is the inverse relationship between the unemployment rate and th...

2

content.screencast.com/use...SPX112713.jpg
$SPX Hourly Chart
Looking for a nice bearish reaction on a break under this trendline.

1
hfc
Holly Frontier

Untitled.jpg

hui
Mania in the mirror, the downside mania in gold stocks...

spx
T minus 4... 3... 2... 1...
2

ERY DAILY.png
$ERY: Potential bullish falling wedge

20131126DBB.png
PowerShares DB Base Metals (DBB) right near summer lows. Have been sitting on some BOM (double short) and BOS (sho...

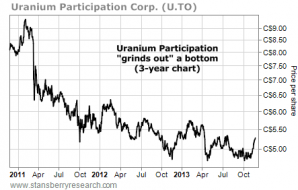
U.TO
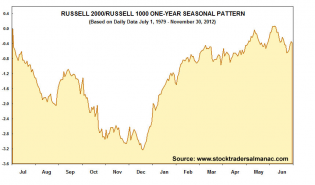
11-25-13-r2-vs-r1.png (856×505)