Date: November 28, 2013

EURUSD 60 MIN.png
$EURUSD: It should be close to a reversal (wave B)

cdn.socialtrade.com/comsys..._0GeS6U_m.png
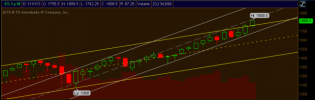
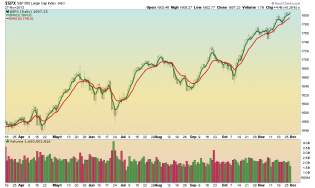
This ES chart looks good on monthly, daily, and hourly time-frames. This particular chart is 3Y monthly. Nothing s...


Trading channels: Russell2k is the leader again
Oil may be bottoming this time.

1
http://content.screencast.com/users/Jim_Nf6/folders/Jing/media/018e...
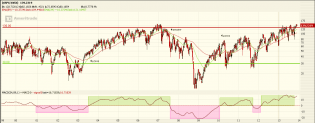
SPX/VIX ratio chart


SPXU DAILY.png
$SPXU: A bullish falling wedge should match with a bearish rising wedge of SPX

USDJPY.png
$USDJPY: Maybe we have an ending pattern
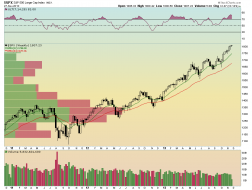
$SPX
SPX weekly with 13 and 34 EMAs (11/27/13)
Up, up and away!
1
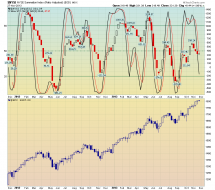
$NYSI
NYSE Summation Index and slow stochastic (5,3) (11/27/13)
This past sell signal did not work.
$SPX
SPX daily with 3 and 10 EMAs (11/27/13)
We are 30 points above the most recent short term low.

EURUSD 120 MIN.png
$EURUSD: Zig Zag scenario