Date: November 5, 2013

es 30 min.png
$ES_F (Globex): It is a wave (B) but it can top at marginal higher high or DT


eur 60 min.png
$EURUSD: Current bounce is a wave (B) (Preferred)

spycrudecorelationchickencatchupnov5.jpg (1569×737)
Since 2008, Crude Oil and the S&P 500 have often moved in sync, a high degree of correlation. The chart above high...
1

newsletterwritersbullish7thtimenov41.jpg (1002×666)
Newletter writers only been this bullish 7-times in 16-YEARS!
1

20131105_obama.png (600×545)
Obama Disapproval Rating Nears Record High
1
cdn.socialtrade.com/comsys..._mjkV6q_m.png

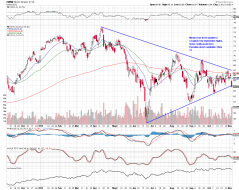
EWW
Short Mexico on break of trendline. EWW failed to capture September highs post more QE drugs and now that the mark...

2

spx 5 min.png
$SPX: The sideways pattern is approaching the end

spx 5 min.png
$SPX: Flat or Triangle should conclude the TZZ wave (B)
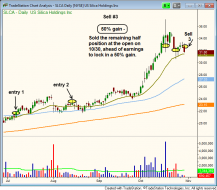
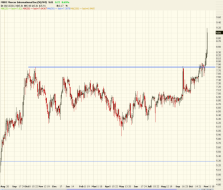
The breakout setup in $SLCA
How We Traded The Breakout In Silica Stock For A 43% Gain (Trading Strategy Article): http://blog.morpheustrading....

Market Zone: Photo
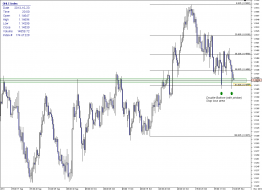
AUDNZD is setting up for a possible long entry. Support area, 61.8 fib level and a double bottom signaling that we...

XME Daily
Bottom Breakout


SPX 15 MIN.png
$SPX: Follow up s/t count

VIX 60 MIN .png
$VIX: No clear reversal pattern yet. Unless price is forming a falling wedge

rydex
Safety seeking behavior @ 12 year low. Fed doing its job getting everyone in the risk pool. Rancid water and all...

1
ddd
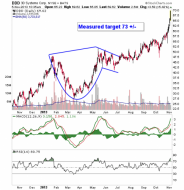
DDD bullish cup & handle, first noted last summer. Now approaching target.

spx 5 min.png
$SPX: Still not clear if the never ending sideways pattern is over
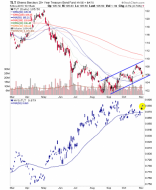
tlt.hyg
While we wait to see if TLT holds the trend line we note that HYG-TLT ratio shows no hidden negative divergence to...
image
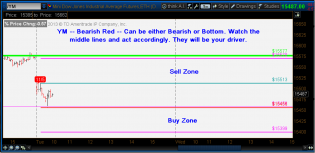
Daytrading Signals for ES, YM, TF, NQ

1

Market Zone: Photo
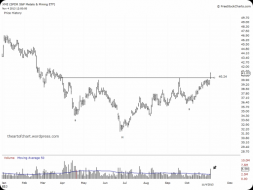
Important announcement on GEVO today. We have massive support area which proved it self lately and 2 harmonic trad...
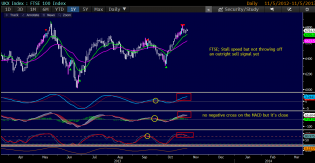
FTSE5.11.png
FTSE; Like many indices, it's moving at stall speed

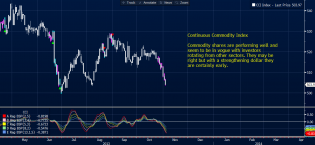
CCI5.11.png
Commodity complex; sugar and iron ore have shown positive signs of life but not enough to lift the rest despite so...
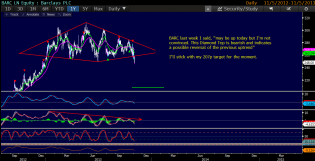
BARC5.11.png
BARC steps into the elevator shaft. This price action neither looks or feels right.
3
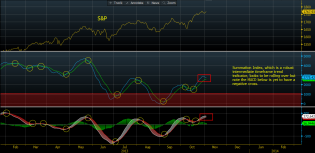
Summ5.11.png
Summation Index; in the zone of indecision.

IBEX 15 MIN.png
$IBEX: Kick off of wave (C) down ?