Date: November 7, 2013

USDJPY DAILY.png
$USDJPY: The wave (E) TR should be in place Measured target of wave (C) = 91.80


IBEX 30 MIN.png
$IBEX: Rollercoaster wave (B) is in place. The wave (C) should test the 50 dma = 9354
1

kingdollarbreaksaboveresistancenov7.jpg (1568×733)
King Dollar breaks out, as Draghi/European banks lower interest rates!
2

tsladangerouskissnov6.jpg (1569×736)
Tesla feeling the impact of this “Dangerous Bearish Kiss of Resistance!”

qratioloftyagainnov61.jpg (1568×734)
Is infinity Ben & QE programs making the Q-Ratio useless?
1
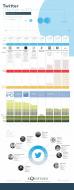
twitter_infograph_final4_superhires.jpg (631×1600)
Twitter's path to its IPO
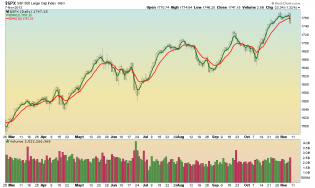
$SPX
SPX weekly with 13 and 34 EMAs (11/7/13)
We have a long way to go for the long term trend to begin turning dow...

1
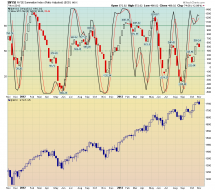
$NYSI
NYSE Summation Index with slow stochastic (5,3) weekly (11/7/13)
I'd like the summation index to be above 1000...
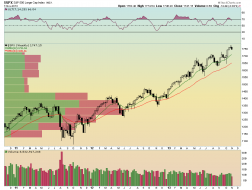
$SPX
SPX daily with 3 and 10 EMAs (11/7/13)
Change in trend - Next lows - 1740 or 1730is.
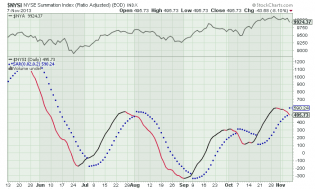
$NYSI
NYSE Summation Index and Parabolic SAR
Sell Sell Sell
1

spx 5 min.png
$SPX: The assumed wave (CI is underway

VIX 60 MIN .png
$VIX: Watching if the wedge is confirmed

content.screencast.com/use.../RUT11713.gif
$RUT Daily Chart
Failed breakout beneath the highs of 10/1 at 1087.78 The rising wedge trendline is sitting at...

1
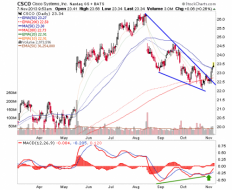
csco
CSCO makes bullish divergence and breaks falling wedge.

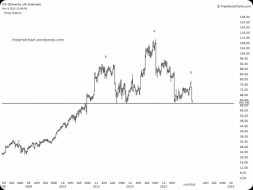
EW Weekly
Edwards Life Support

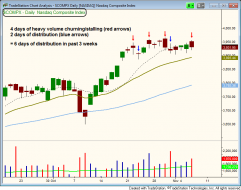
NASDAQ Distribution count
Why Now Is The Time To Play Defense In The NASDAQ: http://blog.morpheustrading.com/3385

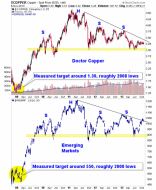
cu.msemf
Doctor Copper prescribes a bearish treatment for emerging markets.

EUR 30 MIN.png
$EURUSD: This rebound should have more business to the upside
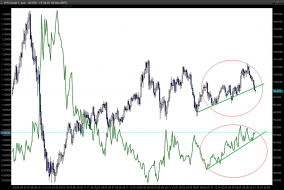
marketzone, technical analysis
USDCAD correclation analysis
