Date: October 11, 2013

joefridaytltmostoversoldoct111.jpg (1568×738)
Bonds (TLT) most oversold in 7-years & creates bullish wick!
1

20131010_EM2.jpg (515×414)
Emerging Market Macro Misery Back At Post-Crisis Highs

The Life And Death Of A Massive Debt Bubble In Seven Charts | Ze...
U.S. debt by sector (ex financials), % GDP

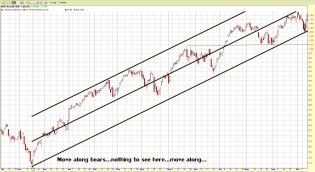
10-11-2013 RUT.jpg
Move along bears...nothing to see here...move along...
Paint the trend lines a little thicker to get rid of those...

2
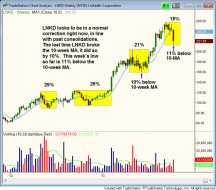
Typical pullbacks in $LNKD
Interesting trading strategy article I came across that talks about how much of a pullback is considered healthy w...


Calm stock trader
How Top Stock Traders Mentally Deal With Sudden Market Reversals (Trading Psychology): http://blog.morpheustrading...
1

Stocks & Housing
We have lot's of "Eiffel Tower" price patterns to refer to that have a fully formed right side to the tower; Japan...


spx 5 min.png
$SPX: Extended move I would be surprised if eod print > 0.618 R = 1698


GDX WEEKLY.png
$GDX: Approaching a potential s/t bottom
1

gold071013.jpg
GOLD SCENARIO UPDATE
SHORTs with an average price of 1326 is heading for the targeted area after breaking 1281 le...

1
Editorial response to October 7, 2013 article in Bloomberg Markets Magazine by David EvansThe October 7, 2013 Bloomberg Markets Magazine hit piece “How Investors Lose 89% of Gains from Futures Funds,” by David Evans, contains more...
Fleeced by a Fool — How Bloomberg Markets Magazine knowingly u...


$EUO 60 MIN.PNG
$EUO: Potential s/t bullish setup #euo #eur #uup #elliottwave

EUR DAILY.png
$EURUSD: Potential H&S #eur #elliottwave