Date: October 16, 2013
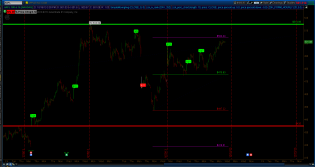
AMZN_HRLY_2013-10-17.png

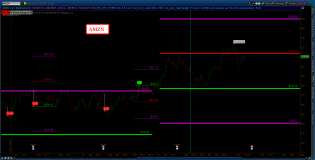
AMZN_DLY_2013-10-17.png
AAPL_HRLY_2013-10-17_0115.png
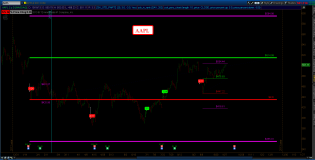
AAPL_DLY_2013-10-17_0113.png
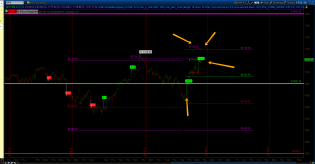
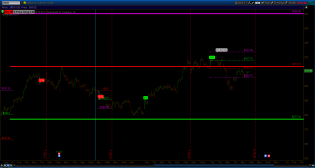
SPX_HRLY_2013-10-16_2219.png
SPX_HRLY_2013-10-14_2157.png

SPX_DLY_2013-10-14_2150.png
SPX
1

ES 15 MIN.png
$ES_F (Globex) : Penultimate wave of the DZZ count

1
Could not find the End of the World stack.
From Cascading Complexity To Systemic Collapse: A Walk Thru "Soc...
Could not find the End of the World stack.

content.screencast.com/use...5014/2011.gif
Great moments in Congress vs the Market
Part I.... Debt Ceiling 2011
Congress approved the rise in the debt ce...


content.screencast.com/use...4353/TARP.gif
Great moments in Congress vs the Market
Part I.... TARP.
The spike caused by Congress approving TARP was the...

Trading channels: Not many words more charts
Not so bearish.


VXX DAILY.png
$VXX: If 13.42 does not hold potential bottom in the range 12.81-12.50 #vxx #elliottwave

TLT 5 MIN .png
$TLT: An impulsive sequence should be done/almost done

spx 5 min.png
$SPX: I switch to the DZZ option

SPX 15 MIN.png
$SPX: So far the impulsive wave (C) option looks o
1

TLT DAILY.png
$TLT: Likely kickoff of a wave (C)
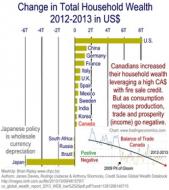
Wealth Change
The October 2013 Credit Suisse Global Wealth Databook contains lots of comparitive charts on recent national and g...


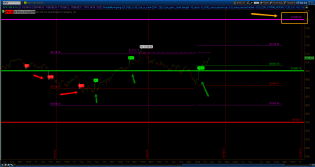
spx 30 min.png
$SPX: Trend off the Oct 9 lod is up until we see a 7-wave advance (Now in wave #5)

Picture 5
S&P 500 Has a Rocky History After Congressional Deals

QQQ 10.16sc.png
QQQ in target zone. Watching for reversal here. F/U from my post of 9/9. Have a great day. Tom B

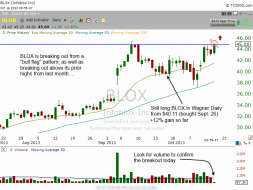
BLOX.png
$BLOX breaking out to new high...

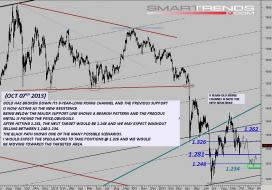
gold071013.jpg
For those who ask, we are holding on to this scenario, after realizing 50% of the SHORTS (+71$) under $1260 per ou...

1
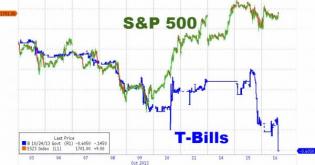
Treasury Bills Are Collapsing As Stocks Surge Once Again | Zero Hedge
T-Bill vs SPX divergence continues to widen.

eur 60 min.png
$EURUSD: Triangle wave (B) ?
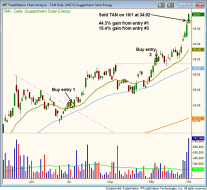
Sold $TAN for large gain
Useful trading strategy article that details 4 technical signals that enabled us to recently gain 44% trading a so...

YG 60 MIN.png
$YG_F: Potential Bullish setup

eur 60 min.png
$EURUSD: A corrective EWP. Now downside action seems less appealing