Log In
|
Create Account
Chart
Chart Lab
Drawn Objects
Guide to Patterns
Mobile Charting
Modes
Power Features
Reference Manual
Rotation Graphs
SlopeCharts
Video Guide to SlopeCharts
Equities
Biggest Companies
Correlations
Earnings
International Equities
Logo-Based Calendar
Real-Time SlopeAlerts
SlopeMATRIX
Super Summary
Today’s Movers
Woulda Shoulda
Markets
Commodities
CryptoStream Live
Economic Database
End-of-Day Report
Macroeconomics
Market Meter
MetaSymbols
SlopeRules
The Matrix
Yield Curve Tool
Options
Backtest Strategies
Chain Quotes
Earnings Reactions
Options Analytics
Payoff Analyzer
Strategy Explorer
Trading Strategies
Virtual Trading
Volatility Calendar
Volatility Matrix
Read
Best Posts of All Time
Books by Tim Knight
Comments Search
Guide to Comments
Latest Posts
Mobile Apps
Profile of Your Host
Recommended Books
SlopeBot GPT AI
Watch Slope Videos
Social
Activity Feed
Browse Chart Database
Guide to SocialTrade
Hall of Fame
Members Directory
Published Watch Lists
Publishing/Subscribing
Search SlopeRules
SlopeTalk LIVE
Virtual Trading
Help
Best Pages For You
Guide to the Site
Membership Levels
Pattern Video Library
SlopeCharts Reference
SlopeMatrix Guide
SlopeRules System Builder
SlopeTiles Customization
Using SlopeTalk
Video Guide to Slope
Log In
Create Free Account
Memberships
Date
:
October
17, 2013
sc.png
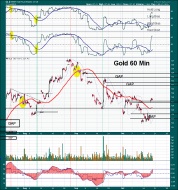
When it comes to Gold, I'm like spooky Mulder. I want to believe. Mind the Gaps.
Trading channels: Getting excited?
Don't get too excited
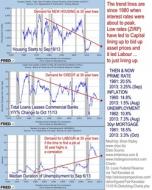
US Housing, Credit & Employment
The North American "Spring" seems nowhere in sight, so forget the revolution. Perhaps the reset will be a "restructur...
SPX WEEKLY.png
$SPX: Roller coster since June low suggests an ED bulls (The FED) want to kill it
SPX 15 MIN.png
$SPX: The s/t count is getting entangled
1
spx 5 min.png
$SPX: A s/t top could be in place
VIX DAILY.png
$VIX: Equity bulls would not like a daily Hammer
SPX 15 MIN.png
$SPX: Back to the DZZ count 1 x 1 extension achieved. 1 x 1.618 = 1731.50
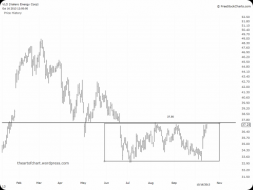
VLO Daily
The Largest Corporate Spinoff in 1980
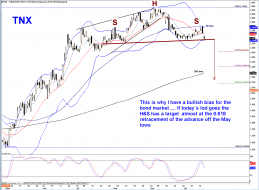
TNX DAILY.png
$TNX: If the neckline goes = Kickoff of Bond market rally
spx 60 min.png
$SPX: 60 min RSI negative div is suggesting that a s/t top should be close
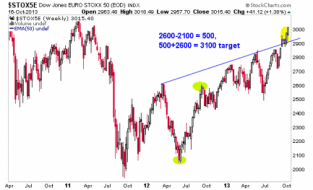
stoxx
EURO STOXX 50 over bought and nearing long standing target (and resistance) of 3100 by this weekly chart. If you...
1
XLI 60 MIN .png
$XLI: Potential Triangle wave (B)
YG 60 MIN.png
$YG_F: The wedge is most likely done
EUR DAILY DZZ.png
#EURUSD: Bigger picture EW count
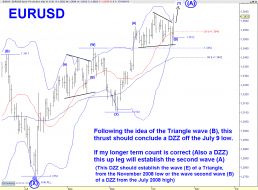
EUR 120 MIN TR.png
$EURUSD: This looks like a thrust following a Triangle