Date: October 18, 2013
2013 v 1967 analog.png

3
oct17
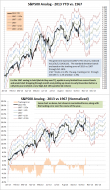
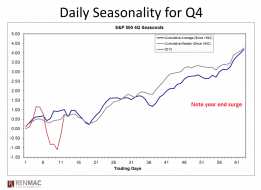
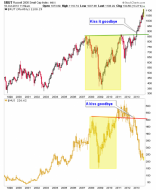
1) Blue line -this is the average stock market performance in the last quarter of the year (Q4) since 1942
2) Key...

2
JNK_HRLY_2013-10-18.png

2
goog
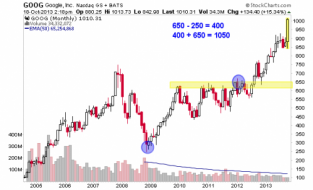
GOOG target is 1050. I wish it was as easy as taking a measurement and waiting...

rut.hui
2 indexes, same pattern... very different fates. RUT targets 1350 on a measured basis.
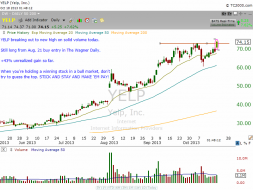
yelP.png
Stick & stay and make 'em pay...


spx 5 min.png
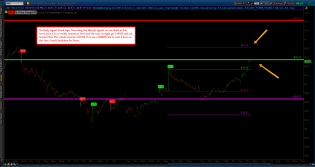
$SPX: Another Triangle´s thrust

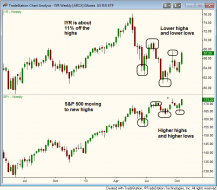
$IYR WEEKLY chart
The Biggest Mistake Traders Make In A Bull Market. Helpful trading strategy article, especially for newer traders:...

spx 5 min.png
$SPX: Instead of a wedge maybe Triangle´s thrust

spx 5 min.png
$SPX: The small ED wave (5) idea

2013-10-18_SPX.png
5 Year SPX chart. Look for possible weakness at the 1750 area.
1

US House Flipping
When it comes to flipping houses in the U.S. it is the very wealthy who excel at the gross margin. Total flipping...


SPX 15 MIN.png
$SPX: If the DZZ is correct the (Y) should unfold one more up leg

Market Harmonics - Nasdaq Sentiment Index

KWN Fitzpatrick I 10-18.jpg
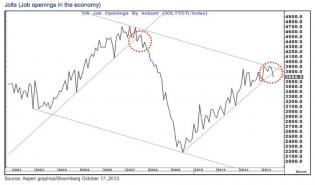
Here's a diamond pattern for you. Job openings.

1

EUR 15 MIN.png
$EURUSD: The thrust following the Triangle can be counted as a 5-wave advance
1