Date: October 24, 2013

EURUSD.png
$EURUSD: Undoubtely price is forming a top. Maybe with an Ending


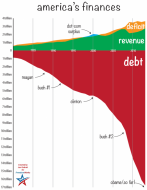
The Chart That The Fed Fears The Most | Zero Hedge
The Chart That The Fed Fears The Most
1
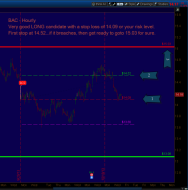
bac
Bullish Stocks...don't know if u guys like it or not.

4

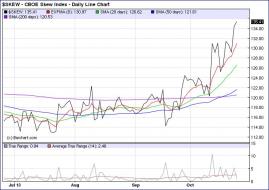
MOST IMPORTANT CHARTS IN THE WORLD Q4 - Business Insider
Banking relative to GDP in various countries
1

MOST IMPORTANT CHARTS IN THE WORLD Q4 - Business Insider
Equity versus GDP
1

MOST IMPORTANT CHARTS IN THE WORLD Q4 - Business Insider
Total bank credit

MOST IMPORTANT CHARTS IN THE WORLD Q4 - Business Insider
The different crude oil contracts

cat.jpg
In honor of Tim's superb writing skill.

1

Guest Post: Buying Stocks On Margin At The Top - They Never Lear...
Mad for margin
2
2013-10-24-TOS_CHARTS.png
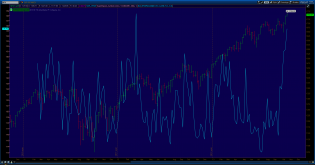
Not sure of correlation with SPX/Skew - here's 5 year SPX weekly with skew overlay. There was one time in May 2012...

2
Clayton Cramer's Blog: Why This Country Is Doomed

1
skew.JPG

tick.JPG

spx 5 min.png
$SPX: watching if the wedge pans ou
1

MLNX completed daily Bat pattern.
2 options strategies which...
MLNX completing Bullish Bat pattern after reports.
If you are bullish like me - buying call spread could be nice...


EUR 15 MIN.png
$EURUSD: Potential ED wave (5)

spx 5 min.png
$SPX: This is an overlapping bounce. It should establish a lower high
USDTRY_INTBANK_20_10_2013.jpg
USDTRY, COMFORTABLE ABOVE THE SAFE ZONE, HOLDING TO OUR LONGS (1.9788)


TSLA broke trading channel and what apears to be the neck line o...
Trading scenario for TSLA
1

market zone
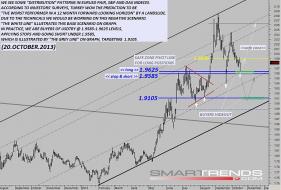
Long term analysis for EURUSD
BRENT_24_10_2013.jpg
Throughout 2013, Brent Oil has been "rebounding", but not "trending". We will be shorting the market, with the fol...
1

EUR 15 MIN.png
$EURUSD: The suggested impulsive sequence could be over