Date: October 3, 2013

ISM Non-Manufacturing Index
ISM Non-Manufacturing Business Activity:
Significantly Slower Growth Rate

globalmarketslookalikepatternsoct3.jpg (1568×687)
Worlds stock markets face “Look Alike” bearish patterns right now!

nysebearishrisingwedgeadlinelowerhighsoct2.jpg (1569×736)
Two thirds of the time stocks fall when this pattern takes place!
1

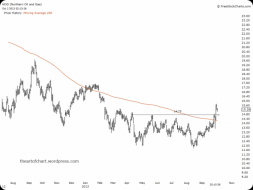
crudeshortnaggaslongoct11.jpg (1569×716)
Why the Power of the Pattern is “short Crude oil & Long Nat Gas”
1

apple30yearsupportresistancesept301.jpg (1569×687)
Can Cook & Icahn push Apple past this 30-YEAR resistance?

iytbreakingsupportatresistancesept27.jpg (1568×737)
Dow Theory breakdown starting at channel & Fibonacci resistance?

content.screencast.com/use.../VIX10313.gif
Important trendline and horizontal line breaks today in the VIX.

AAPL.PNG


es 60 min.png
$ES_F (Globex): If the following count is correct one more down leg is needed


usd
US dollar chart is a mess. Targets mid-high 70's. Chart somehow spawned a screed about not joining cults if you...

3
NOG Daily
Knock Nog


spx 60 min.png
$SPX: Getting closer to a bottom
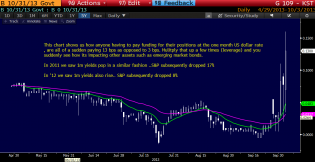
1monthfunding.png


USO 15 MIN .png
$USO: With 5 up more upside should be expected after a corrrective phase
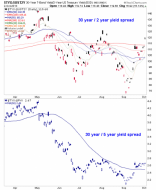
30.2.30.5
Yield spreads continue to look constructive for further rise, regardless of whether nominal yields rise or drop. T...

Trading channels: SPX only
Still cautiously bearish.
