Log In
|
Create Account
Chart
Chart Lab
Drawn Objects
Guide to Patterns
Mobile Charting
Modes
Power Features
Reference Manual
Rotation Graphs
SlopeCharts
Video Guide to SlopeCharts
Equities
Biggest Companies
Correlations
Earnings
International Equities
Logo-Based Calendar
Real-Time SlopeAlerts
SlopeMATRIX
Super Summary
Today’s Movers
Woulda Shoulda
Markets
Commodities
CryptoStream Live
Economic Database
End-of-Day Report
Macroeconomics
Market Meter
MetaSymbols
SlopeRules
The Matrix
Yield Curve Tool
Options
Backtest Strategies
Chain Quotes
Earnings Reactions
Options Analytics
Payoff Analyzer
Strategy Explorer
Trading Strategies
Virtual Trading
Volatility Calendar
Volatility Matrix
Read
Best Posts of All Time
Books by Tim Knight
Comments Search
Guide to Comments
Latest Posts
Mobile Apps
Profile of Your Host
Recommended Books
SlopeBot GPT AI
Watch Slope Videos
Social
Activity Feed
Browse Chart Database
Guide to SocialTrade
Hall of Fame
Members Directory
Published Watch Lists
Publishing/Subscribing
Search SlopeRules
SlopeTalk LIVE
Virtual Trading
Help
Best Pages For You
Guide to the Site
Membership Levels
Pattern Video Library
SlopeCharts Reference
SlopeMatrix Guide
SlopeRules System Builder
SlopeTiles Customization
Using SlopeTalk
Video Guide to Slope
Log In
Create Free Account
Memberships
Date
:
October
4, 2013
Citi Warns US Equities Are A Cocktail of 2011, Slice Of 1998, Da...
DJIA pattern today looks very similar to that seen in 2011. (Daily)
2
content.screencast.com/use.../RUT10413.gif
RUT Daily Chart Rising wedge complete, while failing twice at the top of 4 year channel, combined with negative...
2
Rich vs Poor.jpg (605×605)
The rich have assets, the poor have debt
2
Visualizing The Triumph Of Hope Over Reality | Zero Hedge
Visualizing The Triumph Of Hope Over Reality
2
history-of-US-taxes-infographic-800.jpg (800×6147)
The history of taxes
3
sigm
A bullish chart... SIGM
fred
A bearish chart... FRED
spx 5 min.png
$SPX: Leading Diagonal or Rising Wedge ?
spx 60 min.png
$SPX: 60 min chart will improve with eod print above 50 ma
SPX DAILY.png
$SPX: Visible improvement = Harami + VIX BB buy equity signal
spx 60 min.png
$SPX: Bullish falling wedge ?
High-margin debt flashing ‘yellow’ warning to market bulls: strategist
High-margin debt flashing 'yellow' warning to market bulls: stra...
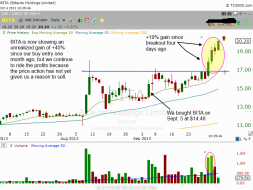
BITA.png
Price action in $BITA has not yet given a reason to sell. Riding the winners and cutting the losers...
Trading channels: Important junction for SPX
Still bearish until ...