Date: October 7, 2013
20131006_brand.jpg (978×675)
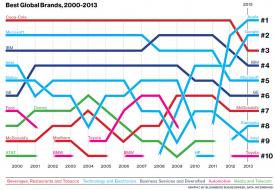
The Rise And Fall Of The World's 10 Most Valuable Brands
2

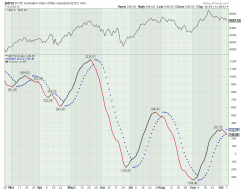
20131007_Greenspan.jpg (978×441)
Having recently showed the diverging "consumer comfort" between the haves and the have-nots, perhaps the following...
1

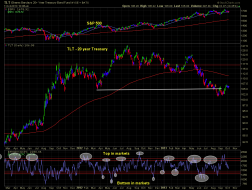
20131007_ES.jpg (950×504)
BofAML Says This Is The Line In The Sand For S&P 500 Downside Risk

20131001_div4.jpg (613×480)
Margin Debt still contrarian bearish

20131007_expensive1.jpg (1219×658)
Is The US Equity Market The Most Expensive In The World?

What Happened The Last 2 Times IPOs Were Outperforming The Marke...
What Happened The Last 2 Times IPOs Were Outperforming The Market By This Much?
$NYSI
$NYSI Short Term Sell Signal


Obama Debt Ceiling.JPG (576×1024)
What a dickhead.
5
EV
When A Diamond Sends You Running for Cover

3

FRED Graph
Total Nonrevolving Credit Owned and Securitized, Outstanding (NONREVSL)

Trading channels: Was turning bullish but...
Was turning bullish but...


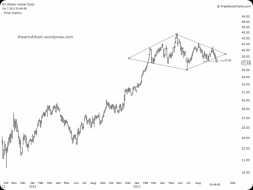
S&P CPi
Stocks adjusted for inflation

spx 60 min ED.PNG
$SPX: Ending Diagonal Option


Nikkeiyenbigmovescloseoct7.jpg (1566×687)
Nikkei action more important to the S&P 500 than the shutdown outcome???
1

6a0105370026df970c019affcc9011970c-pi (618×407)
Rydex Ratio in the Danger Zone

Open Letter.jpg (381×324)
1
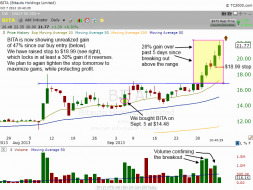
BITA.png
Stop on $BITA position raised to $18.99, which locks in +30% gain if it reverses. Will likely raise stop again tomorrow.


spx 60 min.png
$SPX: Lower highs-HIgher lows ....Maybe price is forming a Triangle
sc-1.png
From David Larew. Looks like TLT wants to form a right shoulder. The drama in dc dovetails into this pattern.


FDAX 60 MIN.png
$DAX_F: The pattern is corrective but it can extend lower
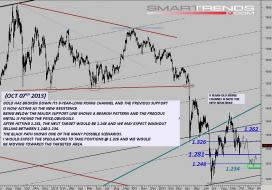
gold071013.jpg
gold

1
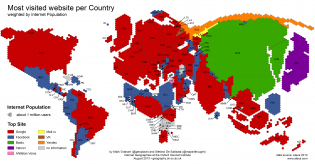
http://geography.oii.ox.ac.uk/wp-content/uploads/2013/08/TopSitePer...
Most visited website per country.

1