Date: September 23, 2013

joefridayshanghaicrbdescendingtrianglessept201.jpg (1562×687)
Joe Friday…Shanghai & key commodity index form bearish pattern!

financialcitibearishwickssept231.jpg (1567×714)
Financials and Citigroup create large bearish wick last week!

500recordinflowhoustonproblemsept20.jpg (1567×692)
Record inflows for stocks

bull-market-corrections.png (1100×610)
Bull Market Corrections, 2009-2013

Fannie Freddie 1 chart.jpg (555×344)
The Role Of Fannie And Freddie In The US Housing Market In One Chart

Sentier Research: Monthly Household Income
The illusion of prosperity
2

The Consumer Price Index: Headline and Core CPI
A long-term look at inflation

Trading channels: Topped or what?
Just topped?


spx 5 min.png
$SPX: Maybe a larger bounce but the weekly gap at 1687.99 is an obvious magnet

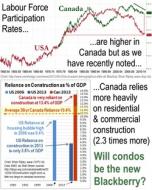
Labour Force Participation
Labour Force Participation Rates are higher in Canada than the U.S. although notice the descending trend and as re...

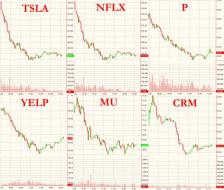
MOMO No Mo? | Zero Hedge
Momo stocks getting killed
2

content.screencast.com/use.../RUT92313.gif
Why this time is different...
RUT 1 year daily chart
First, notice the horizontal lines which served as resi...

3
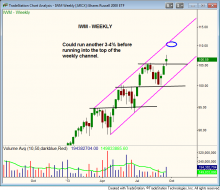
$IWM WEEKLY
Fed Speculation Is Out Of The Way, But Where Are Stocks Headed Next? Here's Our Objective Analysis: http://blog.mo...
