Log In
|
Create Account
Chart
Chart Lab
Drawn Objects
Guide to Patterns
Mobile Charting
Modes
Power Features
Reference Manual
Rotation Graphs
SlopeCharts
Video Guide to SlopeCharts
Equities
Biggest Companies
Correlations
Earnings
International Equities
Logo-Based Calendar
Real-Time SlopeAlerts
SlopeMATRIX
Super Summary
Today’s Movers
Woulda Shoulda
Markets
Commodities
CryptoStream Live
Economic Database
End-of-Day Report
Macroeconomics
Market Meter
MetaSymbols
SlopeRules
The Matrix
Yield Curve Tool
Options
Backtest Strategies
Chain Quotes
Earnings Reactions
Options Analytics
Payoff Analyzer
Strategy Explorer
Trading Strategies
Virtual Trading
Volatility Calendar
Volatility Matrix
Read
Best Posts of All Time
Books by Tim Knight
Comments Search
Guide to Comments
Latest Posts
Mobile Apps
Profile of Your Host
Recommended Books
SlopeBot GPT AI
Watch Slope Videos
Social
Activity Feed
Browse Chart Database
Guide to SocialTrade
Hall of Fame
Members Directory
Published Watch Lists
Publishing/Subscribing
Search SlopeRules
SlopeTalk LIVE
Virtual Trading
Help
Best Pages For You
Guide to the Site
Membership Levels
Pattern Video Library
SlopeCharts Reference
SlopeMatrix Guide
SlopeRules System Builder
SlopeTiles Customization
Using SlopeTalk
Video Guide to Slope
Log In
Create Free Account
Memberships
Date
:
August
14, 2014
spx.monthly
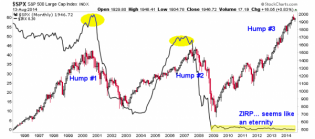
Big macro chart of S&P 500 and the blight known as ZIRP. This one chart ends all discussion about whether stocks...
rut
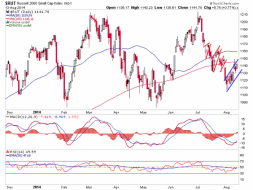
RUT is still in a bear flag, but MACD and RSI are getting bull sneaky. Bearish below moving averages, but if SPX...
2
sox
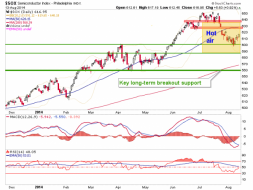
SOX in a bullish little pattern off of 1st support level in the 'hot air' zone. Would think SOX can take another...
spx
SPX short term (60 min. chart) bounce status... still in progress.