Date: August 30, 2014

food_stamp_participation.jpg (618×486)
Percentage of people on food stamps ("SNAP"), state by state

fast_food_map_by_state.jpg (1000×837)
Iconic fast food restaurants, state by state
3

11-28-11pov-rev4-17-14-f3.png (450×439)
Income concentration at the top of the American ladder

Screen_Shot_2014-04-14_at_6.38.50_PM.png (1099×835)
The rising age of marriage

imfchart.png (794×566)
Real GDP and share of population

billionaire-map.0.jpg (1000×892)
Mapping the world's richest people

mckinsey-global-center-map.0.png (945×743)
The economic center of gravity over the past thousand years
1

Gdpercapita.0.PNG (1350×739)
GDP per capita

Trading channels: Weekend charts
Gold targeting 1300.

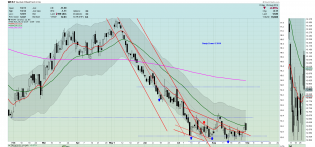
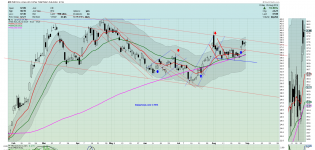
WEAT_daily.png
WEAT is now oscillating between $12.60 and $13.40. Still speculative at this point but the bottoming pattern is ap...

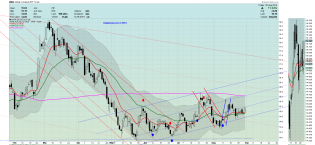
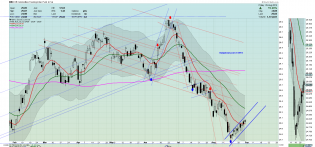
URA_daily.png
I still like URA a lot. EMA(13) is above the EMA(34) and both are closing in on MA(144). URA looks like a good lon...
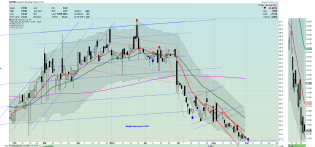
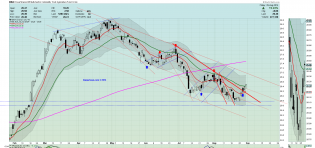
SOY_daily.png
Still might be a little early but a bottoming pattern is emerging. Let's see how it progresses out of it's current...
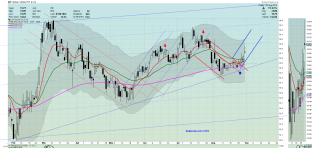
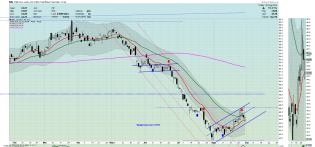
LIT_daily.png
LIT had a good bounce off of a diagonal resistance line. Signifies a higher low. I remain very bullish on LIT.
JO_daily.png
I still really like the look of JO. Above the EMA's on both the daily and weekly charts.
DBC_daily.png
DBC has been on a bit of tear lately. Weekly charts are improved too. It's coming up to a gap which hopefully be f...
DBA_daily.png
DBA is still bottoming but did make a breakout against a resistance line put in place by two lower-highs.

BAL_daily.png
Bottoming pattern still in formation. Watch next week for a break down and retracement to $42.00.