Log In
|
Create Account
Chart
Chart Lab
Drawn Objects
Guide to Patterns
Mobile Charting
Modes
Power Features
Reference Manual
Rotation Graphs
SlopeCharts
Video Guide to SlopeCharts
Equities
Biggest Companies
Correlations
Earnings
International Equities
Logo-Based Calendar
Real-Time SlopeAlerts
SlopeMATRIX
Super Summary
Today’s Movers
Woulda Shoulda
Markets
Commodities
CryptoStream Live
Economic Database
End-of-Day Report
Macroeconomics
Market Meter
MetaSymbols
SlopeRules
The Matrix
Yield Curve Tool
Options
Backtest Strategies
Chain Quotes
Earnings Reactions
Options Analytics
Payoff Analyzer
Strategy Explorer
Trading Strategies
Virtual Trading
Volatility Calendar
Volatility Matrix
Read
Best Posts of All Time
Books by Tim Knight
Comments Search
Guide to Comments
Latest Posts
Mobile Apps
Profile of Your Host
Recommended Books
SlopeBot GPT AI
Watch Slope Videos
Social
Activity Feed
Browse Chart Database
Guide to SocialTrade
Hall of Fame
Members Directory
Published Watch Lists
Publishing/Subscribing
Search SlopeRules
SlopeTalk LIVE
Virtual Trading
Help
Best Pages For You
Guide to the Site
Membership Levels
Pattern Video Library
SlopeCharts Reference
SlopeMatrix Guide
SlopeRules System Builder
SlopeTiles Customization
Using SlopeTalk
Video Guide to Slope
Log In
Create Free Account
Memberships
Date
:
February
20, 2014
gm2.png
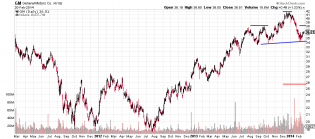
GM is completing the right shoulder to form a head shoulder top.
4
HMN.png
HMN Head shoulder top. This and many other stocks in the property and casualty insurance sector are forming this p...
2
cost.png
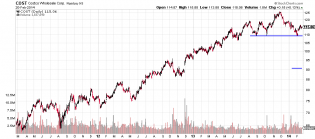
COST head shoulders top
aamc.png
AAMC head shoulders top.
$SPX_195min.png
It will be what it is
SPX 5 MIN.png
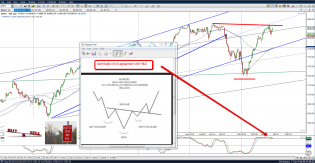
$SPX: The wave (B) should be in place
0219-GLD
2
SPX 5 MIN.png
$SPX: Another Ending Diagonal ?
tyx
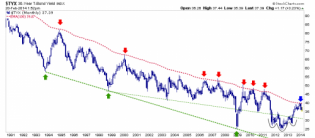
Is all of this forecasting a rise and failed test of the Continuum AKA the monthly view of the 30 year yield?
bkx.spx
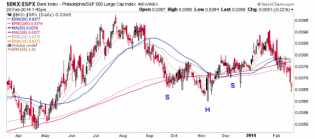
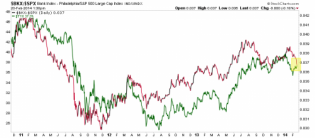
Yet BKX-SPX ratio is doing this... banks benefit from ZIRP vs. rising long yields. What gives?
tyx
30 year yield targets 3.9% or so.
bkx.spx.tyx
Market leader BKX-SPX ratio has gone hand in hand with 30 year yield... until now.
Picture
Anyone with a Twitter feed knows that a lot of correlations are being made this year with the weather. The bottom...
1
SPX 5 MIN.png
$SPX: I expect a lower high with an expanded flat wave (B)
FAZ 60 MIN .png
$FAZ: More sideways could be forming an IHS
USDJPY DAILY.png
$USDJPY: Forming a potential Bearish Flag
NYMO.PNG
$YG_F : This pullback should establish a higher low
YG DAILY.png
$YG_F : This pullback should establish a higher low