Date: February 9, 2014
SPX.png
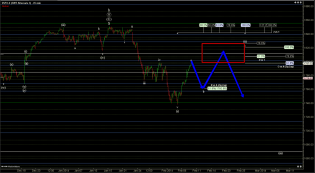
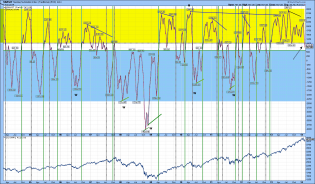
This one of the EW patterns I'm liking, chart from FWTrader.com

3

Picture
In October 2013 we observed that the big profit money in house flipping is in the 2-5 million$ high end range and...

2
20140209_long2.png (1238×884)
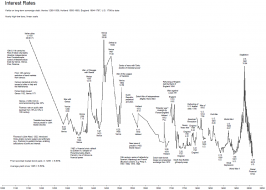
Interest rates over a period of eight centuries
2

20140209_long3.png (1237×883)
Commodity prices since 1165 - nearly 900 years ago!

20140209_long4.png (1240×884)
The price of gold over about 800 years!

20140209_long1.png (1236×884)
Stock prices since 1509 (!!!!!!!!!)


content.screencast.com/use...a/RUT2714.jpg
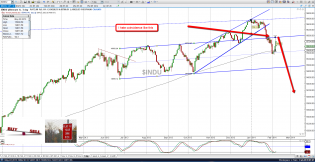
$RUT Daily Chart
On the larger daily view, you can see the RUT has clearly now broken down out of the 1+ year l...

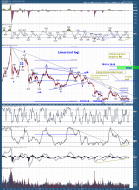
Silver daily 2.9.14sc.png
Just an update on my view of silver (and gold is the same). Personally I think there is a good chance the last maj...

4

content.screencast.com/use...a/RUT2914.jpg
$RUT 30 min chart
Back the chart, since the ManU game/therapy session is done.
Downtrend in RUT still in e...
DJIA.png
whoa Nellie....market never cease to surprise me
$NASIT ema4 long termsc.png
I personally think the QQQ is likely starting a major C wave down. Here is a long term chart of the NASIT (day ema...