Date: January 13, 2014

Trading channels: Auch
AUCH!


20140113_EOD10.jpg (991×880)
Nikkei is down 1000 points from its 2013 close highs...

20140113_1928.jpg (956×500)
Mclellan's 1929 Analog...
8
Just Three Charts | Zero Hedge
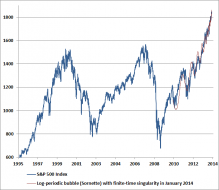
Hussman's Bubble Trajectory...
Based on the fidelity of the recent advance to this price structure, we estimate...

5
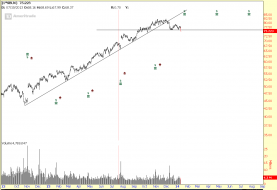
SBUX_2014-01-13.png

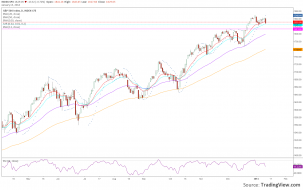
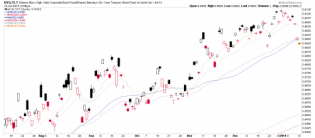
spx_01132014a.png
SPX daily below 13EMA with 20EMA at 1825.77 and prior high of 1813.55 from late November. Also SAR just flipped ne...

1

spx 30 min.png
$SPX: Follow up of the s/t count

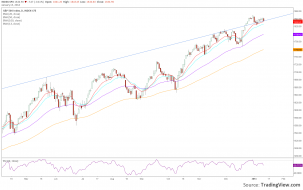
spx_01132014.png
SPX daily - rebound off the 13EMA as in the prior five instances or finally just a drop?
hyg.tlt
Sneaky risk 'OFF' signal still in play w/ junk bonds dropping vs. T bonds. Nominally junk is still okay, but this...


How Much Volume Is Enough?
How much volume is enough for trading stocks & ETFs? (trading strategy article): http://blog.morpheustrading.com/3592


EURUSD 15 MIN.png
$EURUSD: Follow up of the s/t count

TLT WEEKLY.png
$TLT: A bullish scenario