Log In
|
Create Account
Chart
Chart Lab
Drawn Objects
Guide to Patterns
Mobile Charting
Modes
Power Features
Reference Manual
Rotation Graphs
SlopeCharts
Video Guide to SlopeCharts
Equities
Biggest Companies
Correlations
Earnings
International Equities
Logo-Based Calendar
Real-Time SlopeAlerts
SlopeMATRIX
Super Summary
Today’s Movers
Woulda Shoulda
Markets
Commodities
CryptoStream Live
Economic Database
End-of-Day Report
Macroeconomics
Market Meter
MetaSymbols
SlopeRules
The Matrix
Yield Curve Tool
Options
Backtest Strategies
Chain Quotes
Earnings Reactions
Options Analytics
Payoff Analyzer
Strategy Explorer
Trading Strategies
Virtual Trading
Volatility Calendar
Volatility Matrix
Read
Best Posts of All Time
Books by Tim Knight
Comments Search
Guide to Comments
Latest Posts
Mobile Apps
Profile of Your Host
Recommended Books
SlopeBot GPT AI
Watch Slope Videos
Social
Activity Feed
Browse Chart Database
Guide to SocialTrade
Hall of Fame
Members Directory
Published Watch Lists
Publishing/Subscribing
Search SlopeRules
SlopeTalk LIVE
Virtual Trading
Help
Best Pages For You
Guide to the Site
Membership Levels
Pattern Video Library
SlopeCharts Reference
SlopeMatrix Guide
SlopeRules System Builder
SlopeTiles Customization
Using SlopeTalk
Video Guide to Slope
Log In
Create Free Account
Memberships
Date
:
July
31, 2014
XHB weekly 7.31sc.png
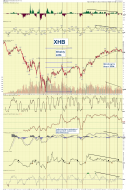
XHB Weekly log. Just a follow of my chart of 6/20 when XHB was 32.15. I would not be surprised to see a drop to...
original_25065502.jpg (1179×665)
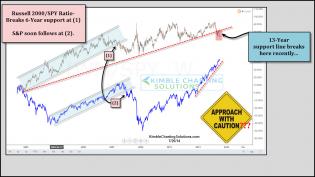
Beautiful break....
4
dow_07312014.png
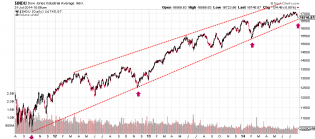
I see this DOW monthly chart which on a weekly/daily basis is breaking that trendline.
1
dowjones.png
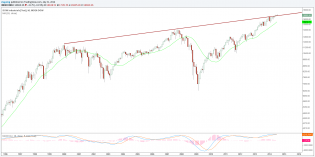
DJIA: Down Jones important level of support for long term trend. If this is broken... the trend will change.
Trading channels: Holiday charts 1
Some more decline ?