Date: May 15, 2014
Trading channels: Indices only today
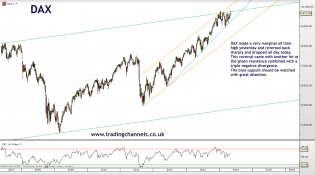
Ze Germanz

1
Trading channels: Indices only today
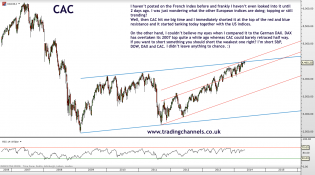
Le French
2
2014-05-15_RUT.png
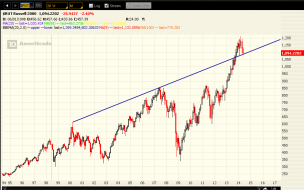
Make or break time for the Russell
1

20140501_rotation.png (1080×1102)
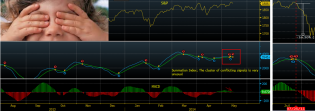
a reminder of just who is "complacent" and who is "selling"
3
When you are looking for an edge in the stock... - The Market Zone

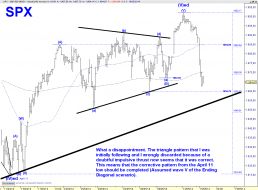
SPX 60 MIN.png
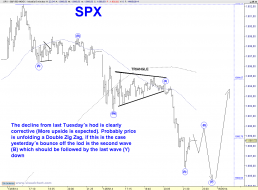
$SPX: The wrongly discarded Triangle now seems it was correct

1
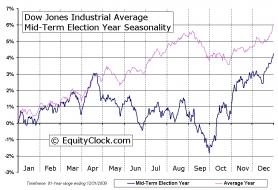
Yr2 - Election Cycle - Mid-Term.jpg

2
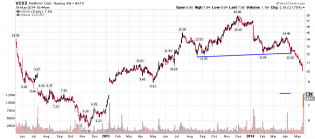
voxx.png
VOXX: Posted this prior to break down just thought I'd share target has been hit.

1

content.screencast.com/use.../SPX51514.jpg
$SPX Daily Chart
The smaller SPX broke down this morning. The larger wedge line is still about 30 SPX pts lowe...

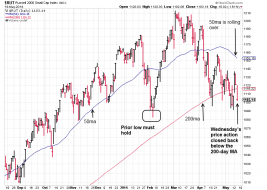
Russell-trouble.png
Institutions continue selling the hell out of small caps. If prior low doesn't hold, look out bulls...


russellndxweaklinksmay14.jpg (1573×701)
The “Weak Links” of this market nearing falling resistance

junkbondspricedtoperfectionmay131.jpg (1296×648)
Junk Bonds acting like its 2000 & 2007 again!

silver18monthrocworstin30yearsmay12.jpg (1124×542)
Opportunity knocking in Silver after 61% decline?
1

weekendnewsspyndxrussellmay10.jpg (1572×705)
Doji, Head & Shoulders top and 200MA break
1

coffeecooloffbreaksupportmay9.jpg (1575×725)
Hottest asset on the planet about to cool off?
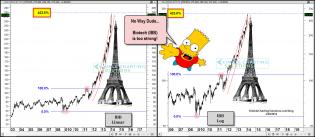
ibbeiffeltowerpatternsfeb28.jpg (1570×684)
Real downside action could start right here and now!

Europe GDP Q1.jpg (834×540)
Europe's "Very Disappointing" Q1 GDP
SPX 5 MIN.png
$SPX: Follow up of the s/t count (DZZ)
Summ15.5.4.png
In the last four sessions the Summation Index on the McClellan Oscillator has generated a sell signal, then a buy...
