Date: May 16, 2014
content.screencast.com/use.../RUT51614.jpg
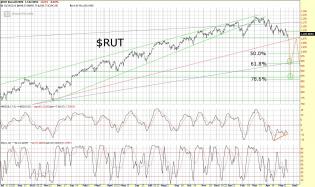
$RUT Daily Chart
The fight is right here. Mon/Tues of next week could possibly set the tone and course for the...

3

The Last Two Times This Happened, The Stock Market Crashed | Zer...
The Last Two Times This Happened, The Stock Market Crashed (Margin Debt)
6
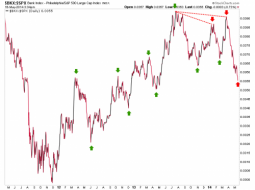
bkx.spx
Bad news? The Bank index keeps burrowing south measured in SPX units and that ain't bullish for the market.

1
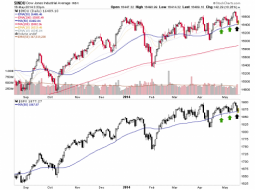
indu.spx
Dow & SPX bounce @ MA 50's per post at site yesterday http://biiwii.com/wordpress/2014/05/15/dow-now-time/ That's...

Appetite for Risk.png
Sundial Capital Research Risk Indicator also at high. This one "aggregates several different indicators of risk-seeki...


blackrock risk.png
Risk indicator from Blackrock at a multiyear high. Calculation includes EBITDA, enterprise value and VIX.
Seen...

WSJ graphic

5

vxn
The fact that the Vixen has declined so much along with the bounce in big tech is not bullish. Bulls do not want...
1
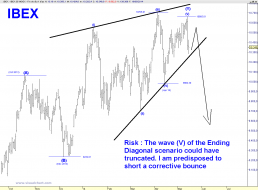
IBEX DAILY.png
$IBEX: I would not rule out a truncated wave (V) (Ending Diagonal scenario)

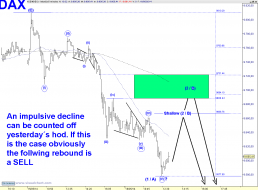
DAX 5 MIN.png
$DAX: Follow up of a possible s/t EW count
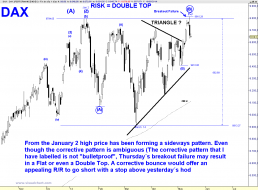
DAX DAILY.png
$DAX: Flat or Double Top ?
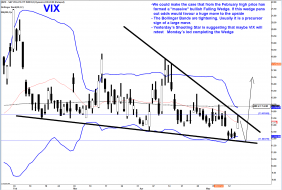
VIX DAILY .png
$VIX: Follow up of a potential Falling Wedge