Date: November 19, 2014

iwm and volitility.png
As we all know usually there is a inverse relationship between the volatility and trend. Here is post processing o...

1
log SPY QQQ XLF.jpg
When I first became interested in stock analysis I noticed sometimes there was what I called "the low before THE h...
1

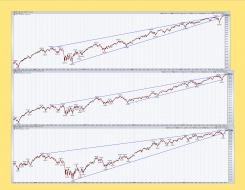
spydivergencestaplediscsmallcapsnov18.jpg (1568×707)
Major divergences

joefridaycrudeoilat50fiblevelnov14.jpg (1570×730)
Crude oil target price
1
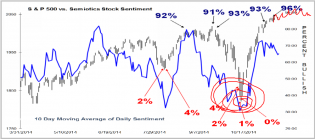
111814sent1.png

10.5.2
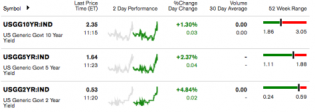
Yield curve declines while nominal yields rise. Message if you choose to go w/ one day's data is... risk 'ON'. Al...

1
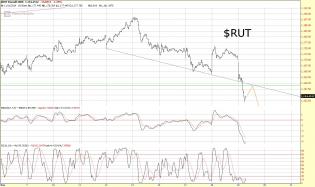
content.screencast.com/use...RUT111914.jpg
Well, the bears finally got the stones up to take back control of the Russell, with today's move back under 1159....

1

20141119_JPY3.jpg (847×504)
Has the annoying Yen/Equity carry trade correlation FINALLY been broken?!?
1
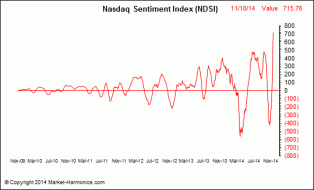
Market Harmonics - Nasdaq Sentiment Index


Market Harmonics - Market Sentiment - Rydex Funds Sentiment Ratio