Date: October 24, 2014
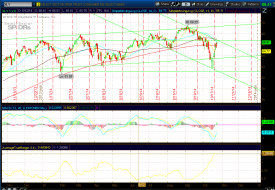
$SPX
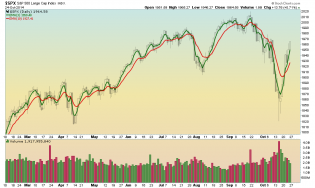
SPX Daily - buy buy buy

$NYSI
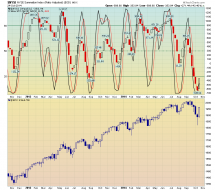
NYSI weekly - initial buy signal. It could form a complex bottom, but we shall soon see.
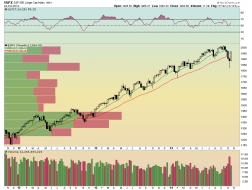
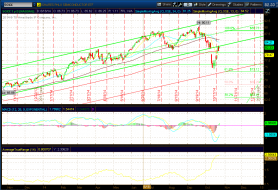
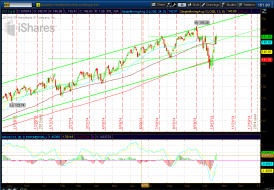
$SPX
SPX weekly - and the bull is back

content.screencast.com/use...SPX102414.jpg
The updated SPX 1929 analog would look something like this. Currently it's on about a 2x timescale to 1929 if the...

2
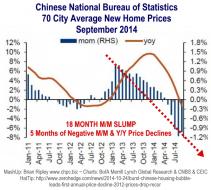
China 70 City Home Prices in 18 Month Slump
CHINESE HOUSING GRINDS LOWER When it comes to net worth, what the stock market is to the US, housing is to China....

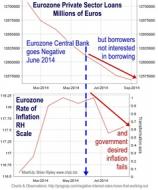
Eurozone negative rate policy fails to get private sector borrowing
The Eurozone central bank nominal negative rate experiment started in June 2014 but is getting panned by the priva...

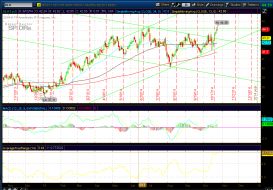
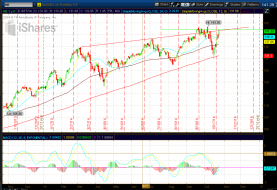
iwm
Small Caps (IWM) rising to a congestion zone w/ 62% Fib retrace, SMA's 50 & 200 and trend line of sorts.

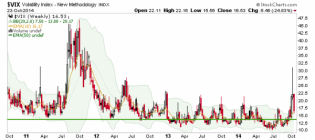
vix.wk
VIX weekly shows new buy level on volatility, poss within the next week or so.
soxx.PNG
SOXX still not back to the primary channel. Still hope for the bears.

xly.PNG
Text book top especially after AMZN news.
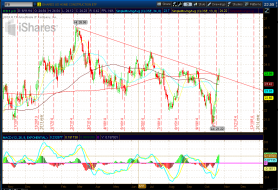
xlu.PNG
Double Top...It will break out. If indices hold.
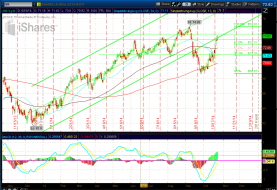
iyr.PNG
Real Estate sure looks about ready for run back to recent highs.
1
itb.PNG
Home Builders look to be breaking trend higher
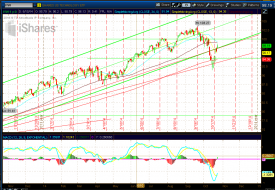
iyw.PNG
Going short Tech now is not a wise idea. Back intot he longer term channel. Next short tgt top of the neck line
ihe.PNG
This sector looks very strong. It does look like this sector looks like a rolling top.
iyt.PNG
Transports a a key area here. I am skeptical about higher.