Log In
|
Create Account
Chart
Chart Lab
Drawn Objects
Guide to Patterns
Mobile Charting
Modes
Power Features
Reference Manual
Rotation Graphs
SlopeCharts
Video Guide to SlopeCharts
Equities
Biggest Companies
Correlations
Earnings
International Equities
Logo-Based Calendar
Real-Time SlopeAlerts
SlopeMATRIX
Super Summary
Today’s Movers
Woulda Shoulda
Markets
Commodities
CryptoStream Live
Economic Database
End-of-Day Report
Macroeconomics
Market Meter
MetaSymbols
SlopeRules
The Matrix
Yield Curve Tool
Options
Backtest Strategies
Chain Quotes
Earnings Reactions
Options Analytics
Payoff Analyzer
Strategy Explorer
Trading Strategies
Virtual Trading
Volatility Calendar
Volatility Matrix
Read
Best Posts of All Time
Books by Tim Knight
Comments Search
Guide to Comments
Latest Posts
Mobile Apps
Profile of Your Host
Recommended Books
SlopeBot GPT AI
Watch Slope Videos
Social
Activity Feed
Browse Chart Database
Guide to SocialTrade
Hall of Fame
Members Directory
Published Watch Lists
Publishing/Subscribing
Search SlopeRules
SlopeTalk LIVE
Virtual Trading
Help
Best Pages For You
Guide to the Site
Membership Levels
Pattern Video Library
SlopeCharts Reference
SlopeMatrix Guide
SlopeRules System Builder
SlopeTiles Customization
Using SlopeTalk
Video Guide to Slope
Log In
Create Free Account
Memberships
Date
:
October
31, 2014
content.screencast.com/use...RUT103114.jpg
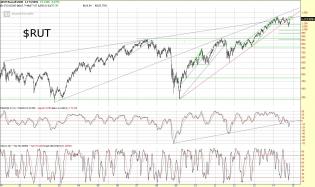
No more pretty bearish forecasts, just an honest look at a long term RUT chart. If you step back and look at a 15...
1
hh.jpg
content.screencast.com/use...son103114.jpg
Hourly Comparison Chart While $SPX is currently challenging its Sept high, TLT and EEM remain with noticeable d...
SLV_M.png
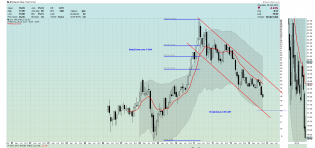
Before the bell, imagine my surprise waking up this morning at seeing silver down 2.5%. Daily and weekly charts ar...
GLD_M.png
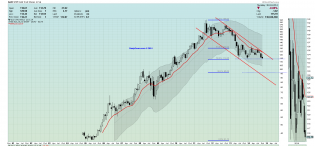
Before the bell, as previously stated in my chart for SLV this morning's fall in precious metals means support wil...
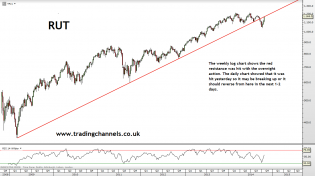
Trading channels: Amazing overnight action
Multi year resistance on RUT