Log In
|
Create Account
Chart
Chart Lab
Drawn Objects
Guide to Patterns
Mobile Charting
Modes
Power Features
Reference Manual
Rotation Graphs
SlopeCharts
Video Guide to SlopeCharts
Equities
Biggest Companies
Correlations
Earnings
International Equities
Logo-Based Calendar
Real-Time SlopeAlerts
SlopeMATRIX
Super Summary
Today’s Movers
Woulda Shoulda
Markets
Commodities
CryptoStream Live
Economic Database
End-of-Day Report
Macroeconomics
Market Meter
MetaSymbols
SlopeRules
The Matrix
Yield Curve Tool
Options
Backtest Strategies
Chain Quotes
Earnings Reactions
Options Analytics
Payoff Analyzer
Strategy Explorer
Trading Strategies
Virtual Trading
Volatility Calendar
Volatility Matrix
Read
Best Posts of All Time
Books by Tim Knight
Comments Search
Guide to Comments
Latest Posts
Mobile Apps
Profile of Your Host
Recommended Books
SlopeBot GPT AI
Watch Slope Videos
Social
Activity Feed
Browse Chart Database
Guide to SocialTrade
Hall of Fame
Members Directory
Published Watch Lists
Publishing/Subscribing
Search SlopeRules
SlopeTalk LIVE
Virtual Trading
Help
Best Pages For You
Guide to the Site
Membership Levels
Pattern Video Library
SlopeCharts Reference
SlopeMatrix Guide
SlopeRules System Builder
SlopeTiles Customization
Using SlopeTalk
Video Guide to Slope
Log In
Create Free Account
Memberships
Date
:
October
6, 2014
Incremental%20Debt.psd
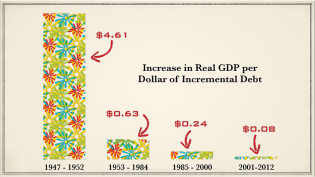
This chart says it all....................
1
djusas.png
DJUSAS: Aerospace head shoulders.
cbst.png
CBST: Few pharm stocks coming to an end. Head shoulders top for this one.
af.png
AF: Head Shoulders Top.
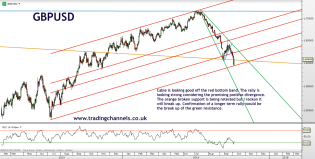
Trading channels: USD weakness
USD correcting
2
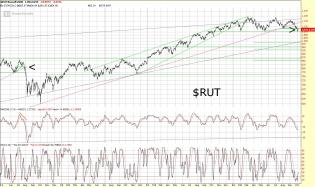
content.screencast.com/use.../RUT10614.jpg
Can't help but notice the similarities. Notice at the beginning of August 2011, $RUT after approaching key suppor...
RecapEUR/USD and USD/JPY disappointed last week for the traders who took contrarian side of the trade. It worked much better for EUR/NZD and EUR/GBP longs for the week. Coming week may be somehow muted in comparing to recent increase...
Blanks of the trader
content.screencast.com/use.../SLV10614.jpg
SLV Daily Chart
1
usd12years.png
US Dollar Index 1985-1997 on top; 2002-2014 on bottom
1
cdn.socialtrade.com/comsys..._3A7izi_m.png
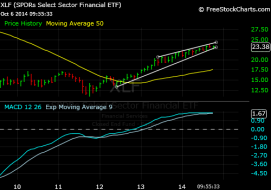
Financials in a wedge on 2-year support.