Date: September 13, 2014
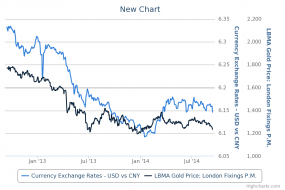
New Chart
Yuan Gold

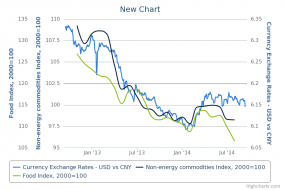
New Chart
Yuan exchange rate versus commodities
2
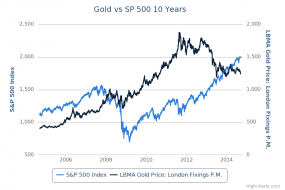
Gold vs SP 500 10 Years
As requested

4
http://content.screencast.com/users/Jim_Nf6/folders/Jing/media/b97e...
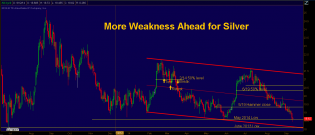
Silver has a date with <$18
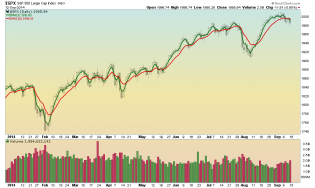
$SPX
SPX daily - 3,10 EMA crossover, bear sniffing?
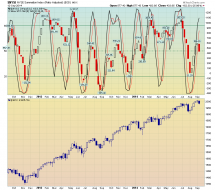
$NYSI
SPX weekly with summation index - no short signal yet
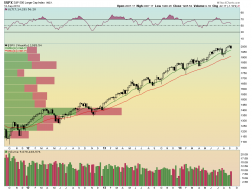
$SPX
Weekly SPX - the bull is unrelenting.
1
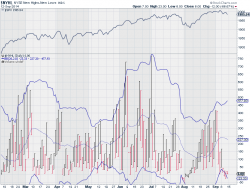
NYHL_09.13.2014.png
NYSE new highs/lows near the extreme bottom seen during early August pullback. Does this mean big upside soon? Any...

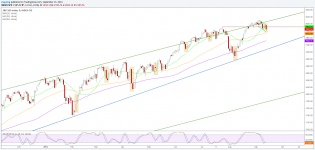
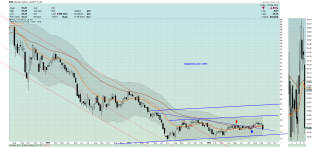
spx_daily_09.13.2014.png
SPX daily showing pullback from top of the channel and also has highlighted Thur/Fri prior to opex. Seems to be bu...
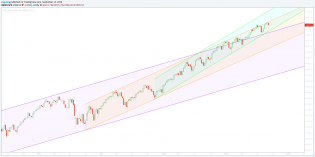
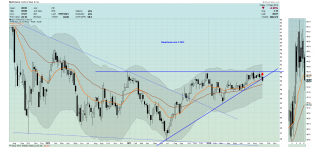
spx_wkly_09.13.2014.png
SPX weekly just pulling back slightly from the top of the middle channel formed in Oct 2012.

Trading channels: Weekend charts
Throwing in the towel?

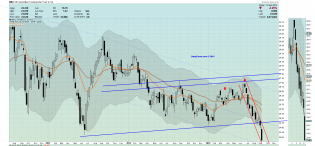
commodities.png
Weekly chart for the commodities index (DBC) and it is not hopeful. This is a really ugly breakdown and as you can...

3
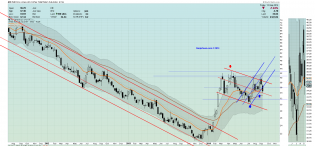
JO.png
Weekly chart of coffee (JO) showing a signficant fall the past two weeks but holding at an intermediate resistance...
1
coal.png
Weekly chart of coal (KOL) after a big descent this week but holding at a previous diagonal resistance line. Worrying...
steel.png
Weekly chart of steel (SLX) breaking it's resistance line.
3