Date: January 30, 2015

20150129_odd.jpg (962×504)
A modest divergence between fantasy (Yellen's stock market) and reality (everything else)
4
ZOES.png
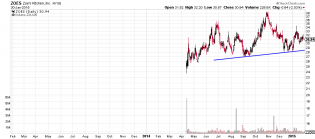
ZOES: This stock has been born to fail. Head shoulder top right out of the IPO. Target 18.00

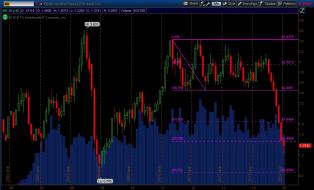
jnug.png
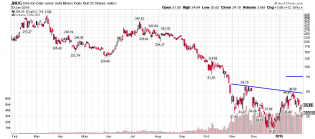
JNUG:I see a head shoulders bottom. 75 would be a good target of the pattern. Let's see if it holds.
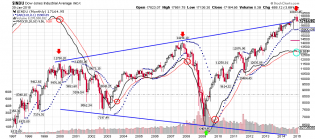
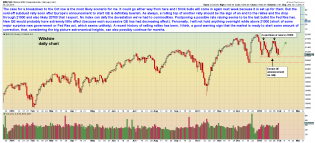
djiamonthly.png
DJIA long term monthly. Today and this month being complete marks a important day for what some may follow is the...
2
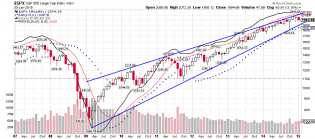
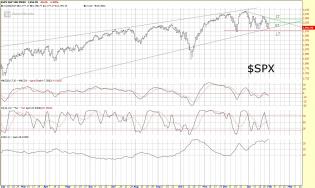
spxlongterm.png
SPX: Monthly rising wedge. When 1900 support is breached have your parachute ready.
1
Screen Shot 2015-01-30 at 6.00.45 PM.png
My thoughts for next week and beyond.

1
content.screencast.com/use.../SPX13015.jpg
$SPX Daily Chart
Nice clean chart with good reversal levels either way, I like it. The good news is this 2 mon...

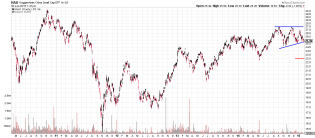
sc8A0OFMCM.png
HAO: Watch out below if support of the triangle is broken.
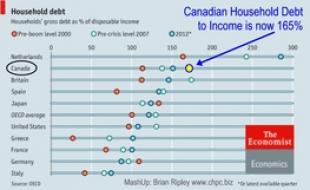
Debt to Income Ratio
There are 3 charts on this page. The top panel shows Canadian Government Spending vs Labour Force Participation an...

1
Gasoline_Futs_Monthly_Jan302015.jpg
Gasoline futures may indicate the long drop in the crude complex is nearing an end.
/rb monthly bear wedge brea...

1