Date: May 1, 2015

20150501_never1.jpg (787×515)
We have never, ever, seen a larger divergence between long-term earnings growth expectations and equity valuations...
2
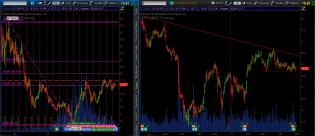
Ford_Monthly_Daily_May012015.jpg
Poor auto sales numbers today put Ford on bear watch.
Monthly chart shows Ford failing to hold trade above $17....

1
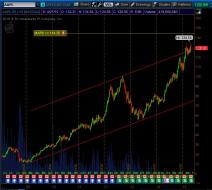
AAPL_Weekly_Channel_May012015.jpg
Another look at AAPL on the larger zoomed out timeframe.
Still nailing the top of the channel.
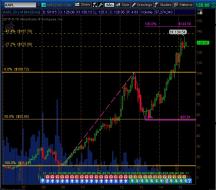
AAPL_Monthly_May012015.jpg
Update on AAPL monthly chart, as we begin May.
**NOTE: tos auto adjusts chart history for split.**
$144.56 w...
1
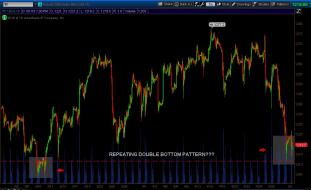
TF_hourly_May012015.jpg
/tf potential repeating double bottom pattern on hourly forming at prior support
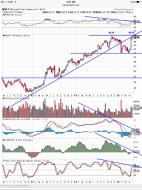
image.jpg
MSFT - like it for puts as it tests underside of long term ascending trend line. Also could be establishing a nic...

1

US Core PCE Price Index - Economic Data Charts - Kshitij.com
